Here’s a quick tutorial on how to create some pretty patterns with the Pimoroni Unicorn HAT (or inferior LED matrix of your choice) and your Raspberry Pi.
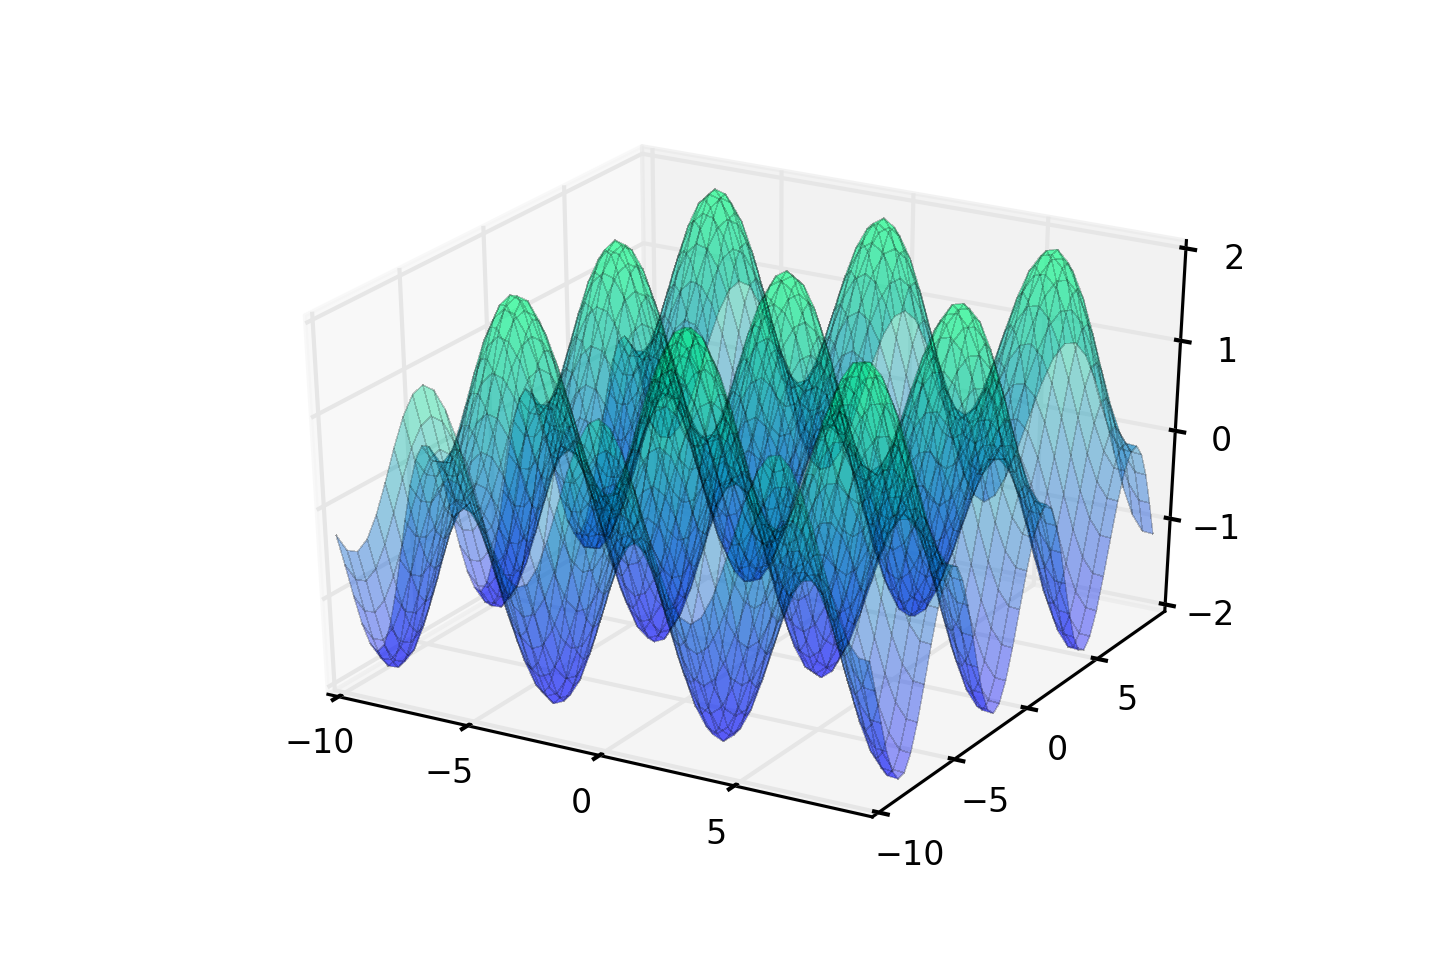
You probably remember trigonometry from school, when you used it to calculate the angles inside a triangle. Well, it turns out that if you use trigonometric functions to transform a set of x and y coordinates to z coordinates and then plot them in 3D space, they look really cool. Below is a simple cos(x) + sin(y) function. If we take those z coordinates and use them to control the brightness of an LED matrix then you get some funky patterns.
Setting it up
All you’ll need is:
- A Raspberry Pi A+ or B+
- A Pimoroni Unicorn HAT
As always, do a sudo apt-get update and sudo apt-get upgrade to get
everything up-to-date on your Raspberry Pi.
You can get my trig.py script from
my fork
of Pimoroni’s Unicorn HAT library as follows:
git clone https://github.com/sandyjmacdonald/unicorn-hat.git
cd unicorn-hat)/python/examples
sudo python trig.py
Or if you already have the library and just want the script:
git clone https://gist.github.com/3971d222b7e74fbb5f7a.git
sudo python trig.py
Stop reading here if you just want to be mesmerised by the blinky lights, or read on if you want to know how it all works.
How it works
We have some boilerplate at the top of our script to import libraries that we’ll need and to dial down the brightness of the LEDs a tad.
#!/usr/bin/env python

import unicornhat as unicorn
import time, colorsys
import math

unicorn.brightness(0.5)
Our function to calculate the brightness values is pretty simple. It takes the
x and y coordinates of each LED and uses the math.sin() and math.cos()
functions from the math library to give us a value for the brightness.
As you’ll see from the graph of the cos(x) + sin(y) function above, the limits on the z axis are -2 and +2, so to get a brightness value between 0 and 1 we just add 2 to the result of our trigonometric function and then divide by 4.
We also have a t value that we pass to the function. This allows us to
increment this value and vary the pattern through time by adding it to the
x and y values on each iteration.
Last of all, to mix things up a bit, we vary our sin + cos function to produce
three different patterns that I’ve called parallel, diagonal and
crisscross.
def compute_z(x, y, t, pattern):
	x = x + t
	y = y + t
	if pattern == 'parallel':
		z = math.sin(x) + math.cos(x)
	elif pattern == 'diagonal':
		z = math.sin(x + y) + math.cos(x + y)
	elif pattern == 'crisscross':
		z = math.sin(x) + math.cos(y)
	z = (z + 2) / 4
	return z
The final part of our program uses a while True loop to keep things running
indefinitely. It loops through a list of our three patterns and runs each for
100 iterations. Then it loops through each x and y coordinate, calculates
the brightness values with our compute_z function and converts the HSV
values to RGB values. We set all of the LEDs to their given values and then
use a time.sleep(0.05) to control the refresh rate which, in conjunction
with the for t in range(100) loop, means that each pattern will run for
about 5 seconds.
while True:
	for pattern in patterns:
		for t in range(100):
			for y in range(8):
				for x in range(8):
					h = 0.1
					s = 1.0
					v = compute_z(x, y, t, pattern)
					rgb = colorsys.hsv_to_rgb(h, s, v)
					r = int(rgb[0]*255.0)
					g = int(rgb[1]*255.0)
					b = int(rgb[2]*255.0)
					unicorn.set_pixel(x, y, r, g, b)
			unicorn.show()
			time.sleep(0.05)
Taking it further
This is just the start. You could use the sin and cos function to also control the colour of each LED or just cycle through different colours. You could combine it with my previous tutorial and use the Pimoroni Skywriter to control the colour of the LEDs with your finger in 3D space, or to control the speed of the animation. Make sure you tweet me to show me what you’ve come up with.