This is the second guide in a series of three, related to collecting home environmental data:
- Setting up InfluxDB and Grafana on the Raspberry Pi 4
- Logging Raspberry Pi environmental data to InfluxDB
- Analysing home environmental data with InfluxDB and R
Background
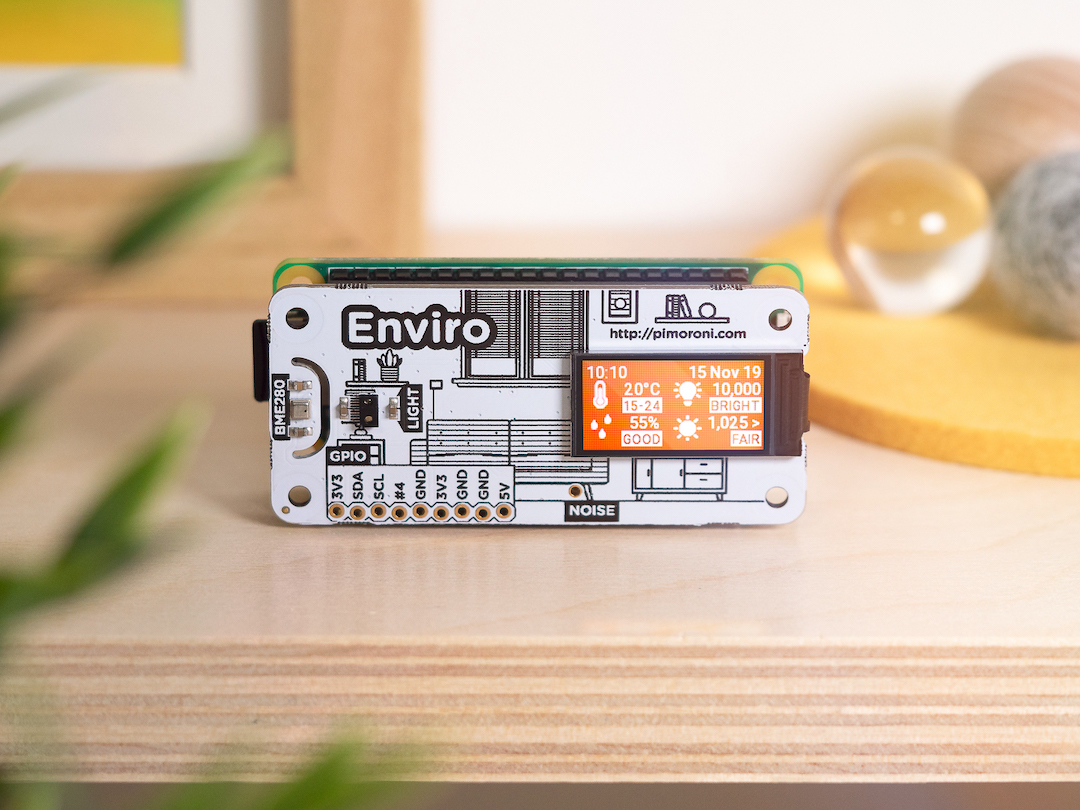
In this guide, you’ll learn how to send environmental data from a Raspberry Pi Zero W with the Pimoroni Enviro board to your InfluxDB database, and how to set up a Grafana dashboard to view the data.
The InfluxDB database and Grafana dashboard needn’t be running on a Raspberry Pi, of course, they could be running on another server in your home or even a remote server if you wish.
The advantages of sending this sort of data to a database rather than just logging it to a text file are that, i) it makes it easy to take advantage of Grafana’s powerful graphing functions, ii) analysis of the data with tools like R is straightforward, and iii) it makes backing up and restoring the data trivial.
We’ll be looking at how to log data from the Pimoroni Enviro board (on a Raspberry Pi Zero W), but there’s no reason that it couldn’t be another sensor or sensors, e.g. a carbon dioxide sensor, a UV sensor, or whatever. The code and principles you’ll learn here are equally applicable to other types of sensor.
Our code will run at 5 minute intervals, logging the data to our InfluxDB database. Temperature, humidity, pressure, and light level will be recorded. I’ve found that a frequency of 5 minutes gives you a decent amount of granularity without generating overwhelming amounts of data.
Here’s what we’ll cover:
- Installing the Raspberry Pi OS
- Installing the Enviro plus and InfluxDB Python libraries
- Logging data to your InfluxDB database
- Using cron to log data every 5 minutes
- Setting up a dashboard on Grafana to view the data
Let’s jump in.
What you’ll need
Like the last guide, there aren’t too many bits needed. Here they are:
Again, you can do the whole setup and have it run headless, so there’s no need for a display, keyboard, or mouse.
Installing the Raspberry Pi OS
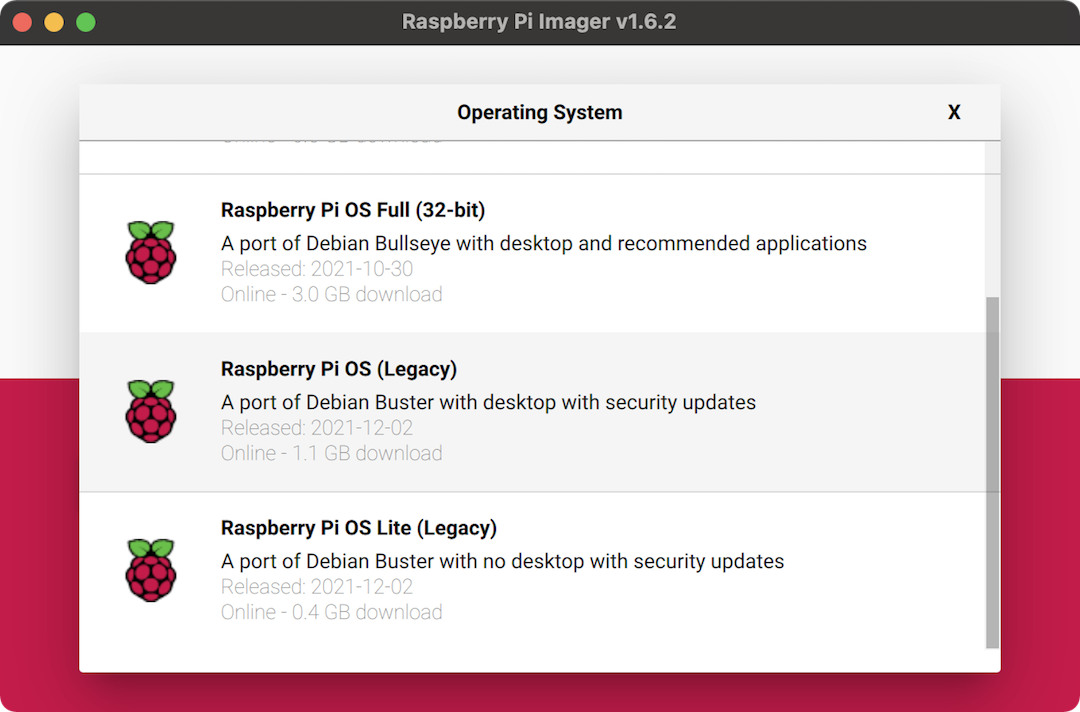
At the time of writing, the new Bullseye release of Raspbian still has some wrinkles to be ironed out in terms of software compatibility, so I’d recommend you use the legacy Buster version that Raspberry Pi have made available.
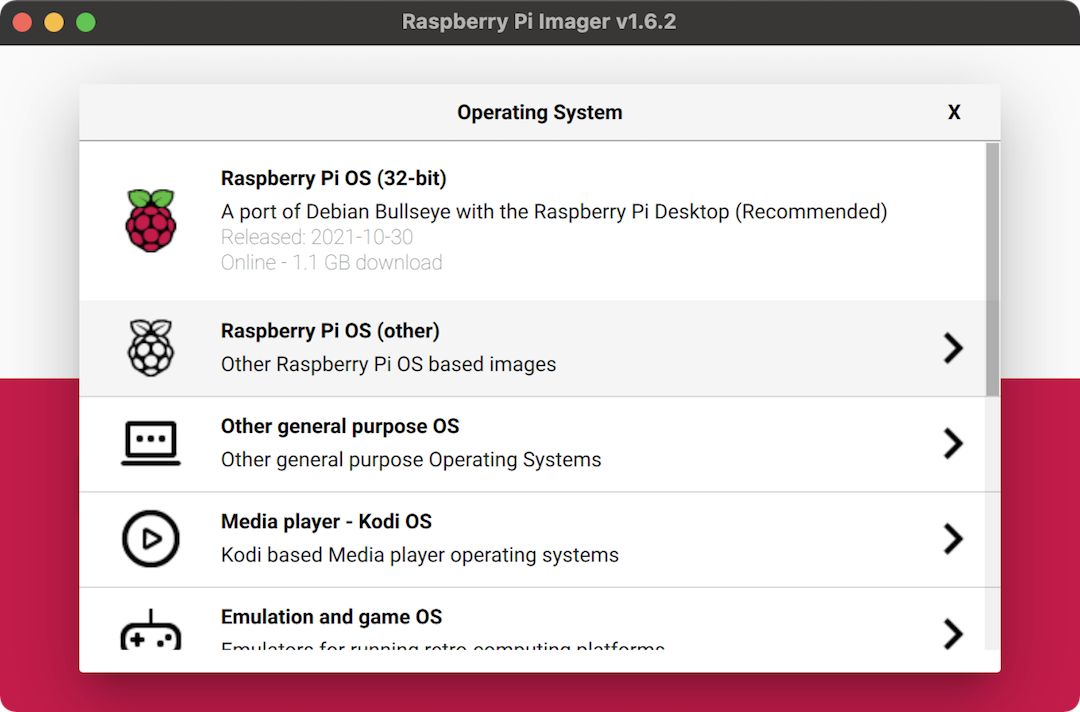
I like to use the Raspberry Pi Imager to burn the image onto my micro SD card, as it gives handy advanced options for enabling SSH, changing the hostname, setting up wi-fi, and more.
Download, install, and open up the Raspberry Pi Imager, and click “CHOOSE OS”. Select “Raspberry Pi OS (other)”, and then select “Raspberry Pi OS (Legacy)”. Pop the micro SD card into your computer, and then click “CHOOSE STORAGE” and select the micro SD card.
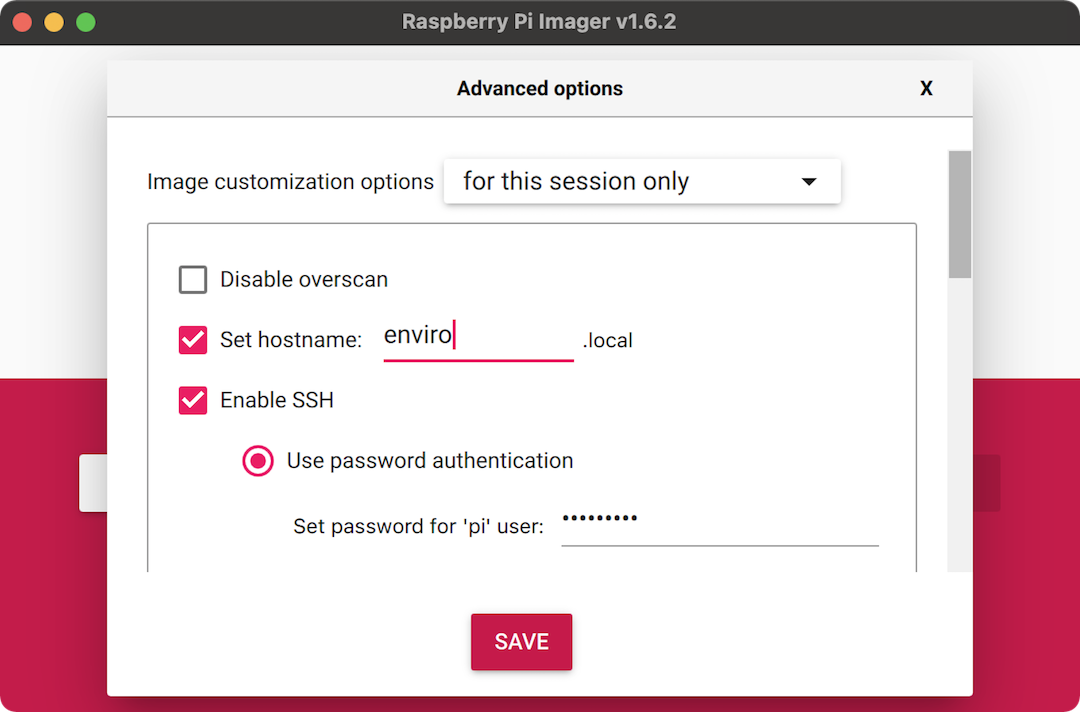
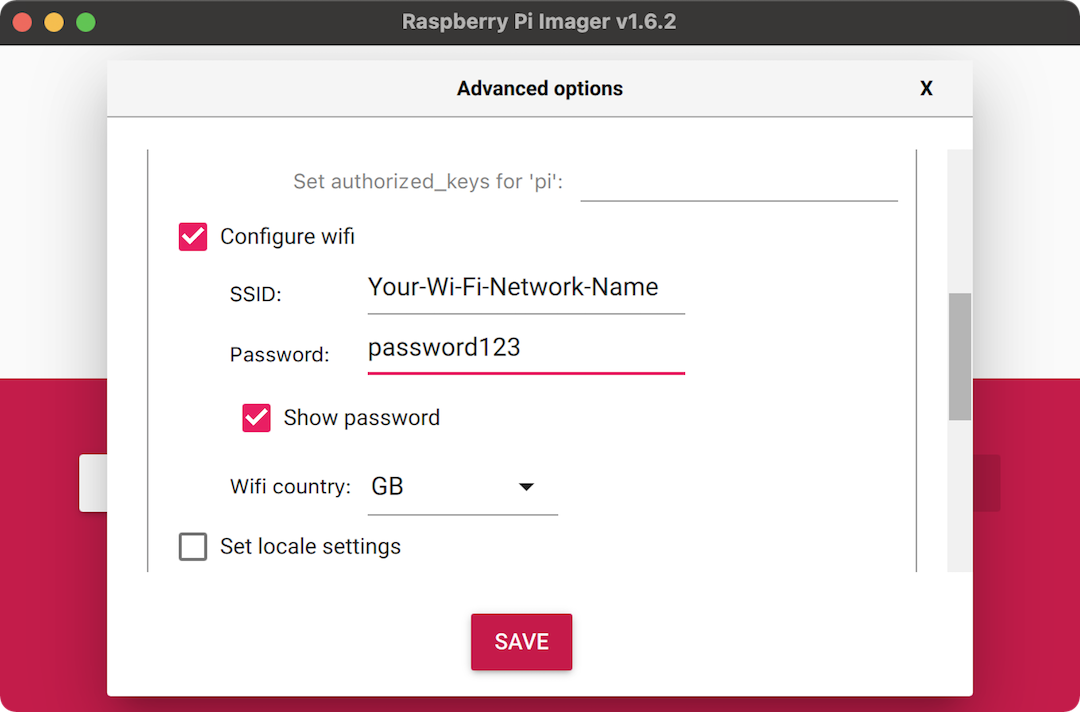
Before clicking “WRITE”, press control-shift-x to open up the super-secret
hidden menu, where you can configure some additional settings. Select the
“Set hostname” checkbox and then call it something like enviro.local, so you
can find it easily on your network. Also check the “Enable SSH” checkbox and
set the password to something memorable and secure. Scroll down a little and
then select “Configure wifi” and enter your wi-fi network’s SSID and password.
Doing all of this will make it really easy to install everything headlessly
once you’ve burnt the image to the micro SD card and booted up your Pi.
Now click “WRITE” to burn the micro SD card.
Pop the Enviro board onto your Raspberry Pi Zero W’s GPIO pins, pop the micro SD card into your Pi and plug the power supply in. The green activity LED should light up and blink to show that your Pi is booting up.
Installing the Enviro plus and InfluxDB Python libraries
To read the data from the BME280 temperature, humidity, and pressure sensor and the LTR559 light sensor on the Enviro board, we’ll need to install Pimoroni’s Enviro plus Python library which installs the required drivers for the sensors. We’ll also need the InfluxDB Python library which will allow us to send the values read from the sensors straight to our InfluxDB database.
Open a terminal on your computer and connect via SSH to your Raspberry Pi Zero W,
by typing ssh pi@enviro.local or ssh pi@192.168.0.101, replacing the hostname
or IP address with whatever the hostname or IP address of your Raspberry Pi Zero
W is. As with the InfluxDB tutorial, I’d strongly recommend that you set a
static IP address for your Raspberry Pi Zero W in your router’s DHCP settings.
This will make connecting to your Zero W via SSH much easier.
Once you’ve entered the SSH password (the one that you set when setting up the micro SD card earlier), you should be connected to your Raspberry Pi Zero W’s terminal. To pull in all of the latest changes to the packages on your Pi, before we go ahead and install the Python libraries, type the following commands:
sudo apt update
sudo apt upgrade -y
Next, type the folllowing to clone the Enviro plus Python library and install it:
git clone https://github.com/pimoroni/enviroplus-python
cd enviroplus-python
sudo ./install.sh
When that’s complete, type the following to install the InfluxDB Python library and to reboot your Pi to make sure everything takes effect:
sudo pip3 install influxdb
sudo reboot
That’s you all set in terms of Python libraries. Next we’ll look at the program that will read the sensor data and send it to your InfluxDB database.
Logging data to your InfluxDB database
Let’s look at the program that will read the sensor values and write them to your InfluxDB database.
Hopefully it should be fairly self-explantory. I’ve added
Change this as necessary comments where you should change IP addresses,
usernames, passwords, and so on, to match whatever yours are.
It’s really important that you get the IP address (the variable host below),
username, password, and database name (the db variable below) correct,
matching whatever you chose when you set up your InfluxDB database.
#!/usr/bin/env python3

import time
import datetime

from bme280 import BME280
from ltr559 import LTR559

from influxdb import InfluxDBClient

try:
    from smbus2 import SMBus
except ImportError:
    from smbus import SMBus


# Logs the data to your InfluxDB
def send_to_influxdb(measurement, location, timestamp, temperature, pressure, humidity, light):
    payload = [
         {"measurement": measurement,
             "tags": {
                 "location": location,
              },
              "time": timestamp,
              "fields": {
                  "temperature" : temperature,
                  "humidity": humidity,
                  "pressure": pressure,
                  "light": light
              }
          }
        ]
    client.write_points(payload)


# Corrects the relative humidity given a raw and corrected temperature reading
def correct_humidity(humidity, temperature, corr_temperature):
    dewpoint = temperature - ((100 - humidity) / 5)
    corr_humidity = 100 - (5 * (corr_temperature - dewpoint)) - 20
    return min(100, max(0, corr_humidity))


# Set up the BME280 weather sensor
bus = SMBus(1)
bme280 = BME280(i2c_dev=bus)
bme280.setup(mode="forced")

time.sleep(5)

# Set up the light sensor
ltr559 = LTR559()

# Set up InfluxDB
host = '192.168.0.100'  # Change this as necessary
port = 8086
username = 'grafana'  # Change this as necessary
password = 'grafana'  # Change this as necessary
db = 'home'  # Change this as necessary

# InfluxDB client to write to
client = InfluxDBClient(host, port, username, password, db)

measurement = "indoor"  # Change this as necessary
location = "living_room"  # Change this as necessary

timestamp = datetime.datetime.utcnow()

# Read temperature (read twice, as the first reading can be artificially high)
temperature = bme280.get_temperature()
time.sleep(5)
temperature = bme280.get_temperature()

# Calculate corrected temperature
offset = 7.5
corr_temperature = temperature - offset

# Read humidity and correct it with the corrected temperature
humidity = bme280.get_humidity()
corr_humidity = correct_humidity(humidity, temperature, corr_temperature)

# Read pressure
pressure = bme280.get_pressure()

# Read light
light = ltr559.get_lux()

# Log the data
send_to_influxdb(measurement, location, timestamp, corr_temperature, pressure, corr_humidity, light)
Important note: because the Enviro board is right above your Raspberry Pi
Zero W, and hence right above its CPU, the temperature and humidity readings
will be affected by heat radiated from the Raspberry Pi. I strongly recommend
using a digital thermometer, sat next to your Raspberry Pi and Enviro board, to
calibrate the temperature readings, by adjusting the offset value as required
until the temperature readings are accurate. In my case, an offset value of
7.5 gives accurate readings.
You should save this program as something like log_to_influxdb.py and then
copy it using scp to your Raspberry Pi Zero W with the Enviro board, as
follows, in a new terminal window:
scp log_to_influxdb.py pi@192.168.0.101:~/
That will copy the program to your Raspberry Pi Zero W’s home directory. Just make sure to replace the filename with whatever you called your file (if it was different to my suggestion) and change the IP address to match the IP address of your Raspberry Pi Zero W.
Using cron to log data every 5 minutes
Rather than having our program run continuously and having to keep track of the time to work out when to send data, we’ll use the bash program cron to run our Python program at 5 minute intervals.
Connect to your Raspberry Pi Zero W via SSH in the terminal, as you did previously.
Type crontab -e to edit your crontab, the list of commands that cron
automates. You’ll be asked to pick which editor to use, if it’s the first time
you’re doing it. I like to use nano.
Once in the crontab, use the arrow keys to go to the bottom, and add the line
below, to run the log_to_influxdb.py program every 5 minutes, so that your
crontab file looks like this:
# Edit this file to introduce tasks to be run by cron.
#
# Each task to run has to be defined through a single line
# indicating with different fields when the task will be run
# and what command to run for the task
#
# To define the time you can provide concrete values for
# minute (m), hour (h), day of month (dom), month (mon),
# and day of week (dow) or use '*' in these fields (for 'any').
#
# Notice that tasks will be started based on the cron's system
# daemon's notion of time and timezones.
#
# Output of the crontab jobs (including errors) is sent through
# email to the user the crontab file belongs to (unless redirected).
#
# For example, you can run a backup of all your user accounts
# at 5 a.m every week with:
# 0 5 * * 1 tar -zcf /var/backups/home.tgz /home/
#
# For more information see the manual pages of crontab(5) and cron(8)
#
# m h  dom mon dow   command
*/5 * * * * cd /home/pi; /usr/bin/python3 log_to_influxdb.py &
To exit nano and save the file, press control-x, then y, then enter.
Your log_to_influx.db.py program will now run every 5 minutes: on the hour,
five past, ten past, etc.
Setting up a dashboard on Grafana to view the data
The final task is to set up a dashboard in Grafana that will let us see the data that we’re now adding to the InfluxDB database. We’ll look at how to add one for the temperature data, and then you can replicate it for the other three variables.
Open a web browser on your computer and open your Grafana dashboard by heading
to http://192.168.0.100:3000 or http://influxdb.local:3000, replacing the
IP address or hostname with whatever is appropriate to your setup.
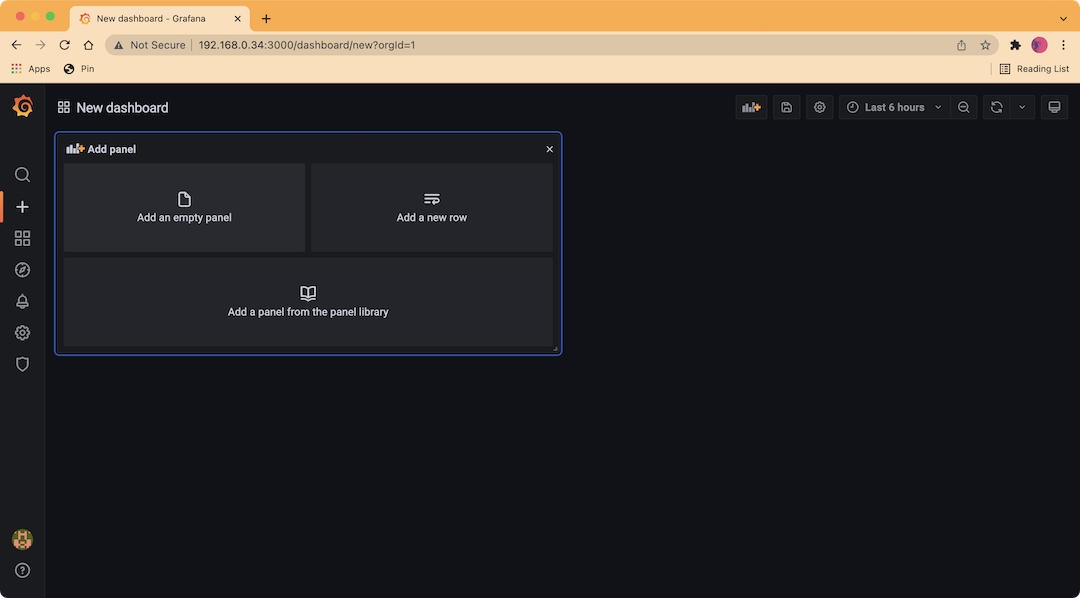
Click on the “+” icon on the left sidebar, and then click “Dashboard” to create a new dashboard. You should see a page with a box at the top left, giving you the option to create a new panel. Click “Add an empty panel”.
You should see the “Edit Panel” window now, where you can configure the panel by selecting the data source, styling the plot in a bunch of different ways, and more. Fortunately, rather than having to type in a complex query to select which data you want to show from the database, there’s a graphical editor where you can build your query.
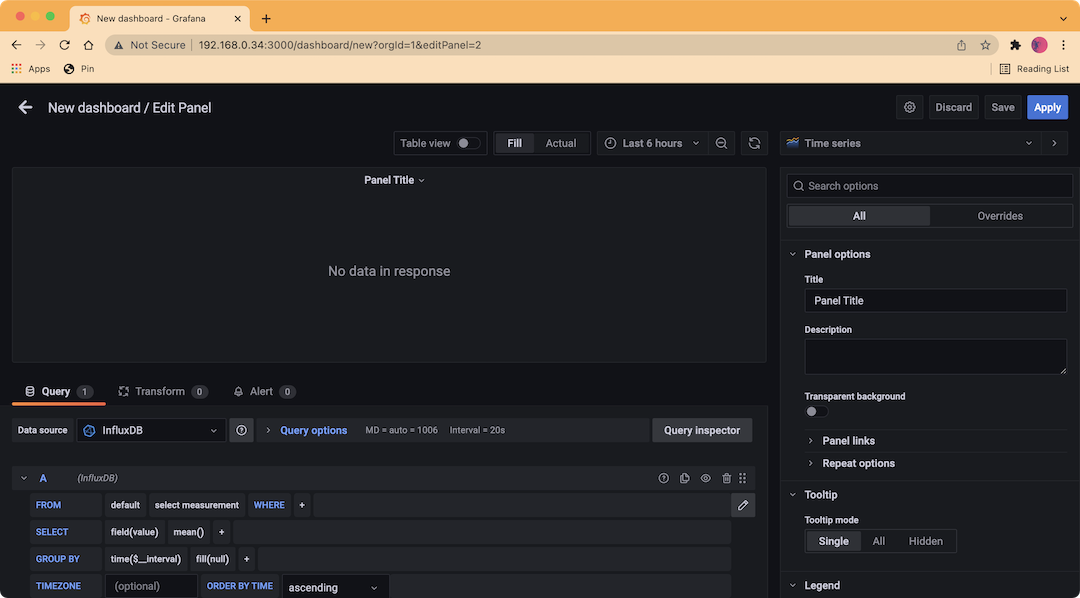
Click on the “select_measurement” box and you should see just one option,
“indoor”, or whatever you set as your measurement variable in the
log_to_influx_db.py program. Click the “+” after “WHERE” and select
“location”, and then click “select tag value” and select “living_room”, or
whatever you set as your location variable in the program.
On the “SELECT” line, click on “field(value)” and then select “temperature”. You should now see some points on your graph! I like to use a moving average to smooth out my plots a little, and you can do this by clicking the “+” after “mean()” and then selecting “moving_average” under “Transformations”. I use a value of 5 for this, and you can change it from the default of 10 by clicking on the 10 in the brackets.
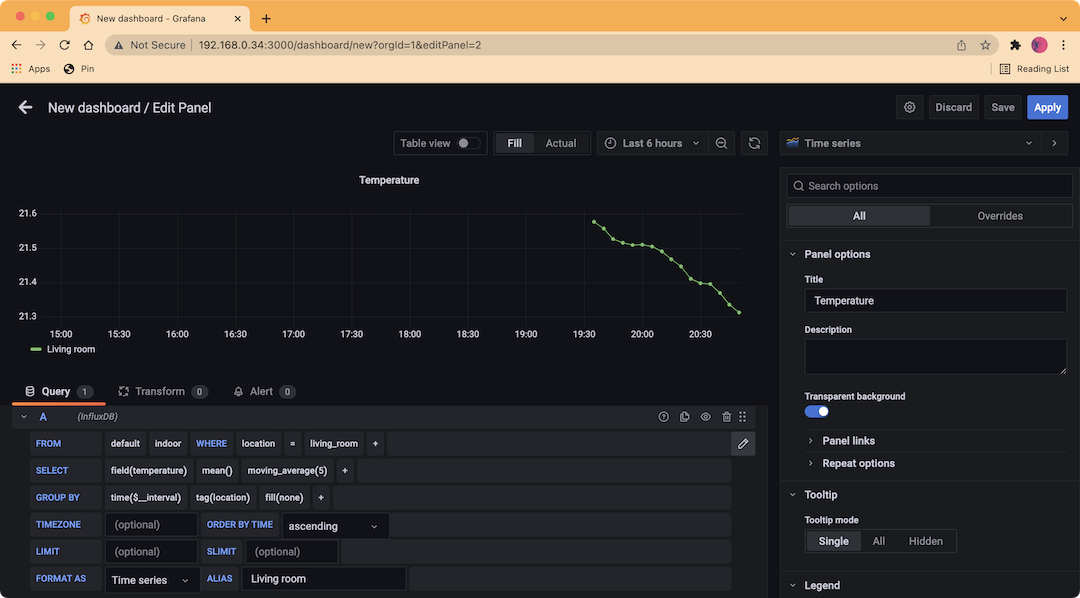
It isn’t too important if you just have a single location, but I also like to “GROUP BY” “tag(location)”, which will group the data if you start adding more sensors in different locations. I also added an alias of “Living room” to make the legend below the graph more sensible looking.
Finally, use the panel on the right hand side to configure the look and feel of your graph, giving it a title, labelling your axes (ALWAYS LABEL YOUR AXES!), selecting the right units, and so on. I won’t go through all of the ways that I styled my graph, as a lot of this is up to your own personal choice.
Click “Apply” at the top right when you’re done to save your panel.
You should also now save your new dashboard by clicking the little floppy disk icon on the top bar and giving your dashboard a name (I called mine “Indoor”).
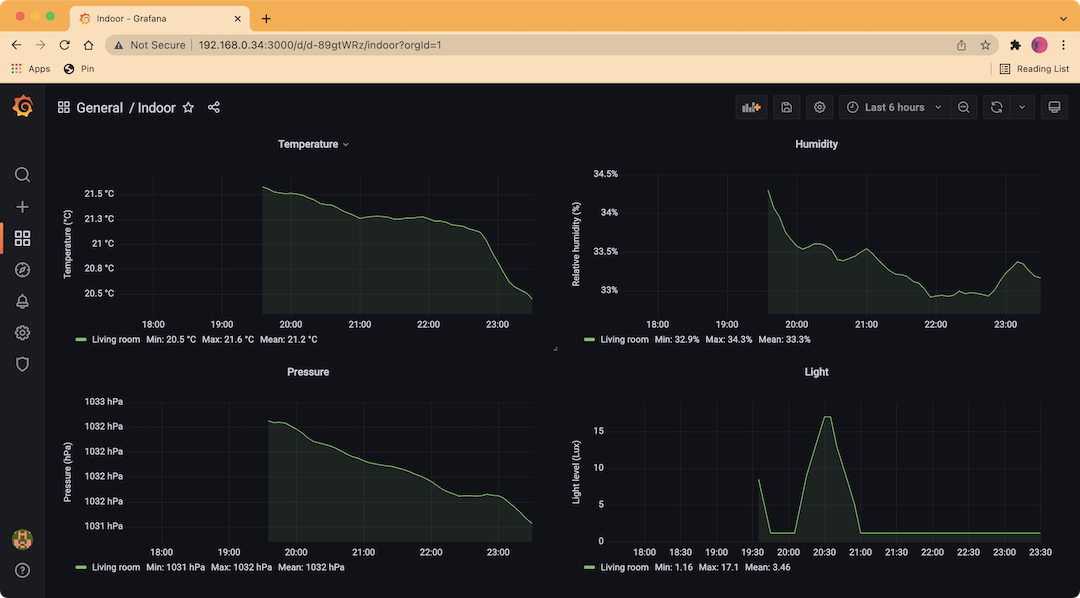
Here’s how my dashboard looked after adding all of the other sensor measurements:
Hopefully now you have a good grasp of how to send data to your InfluxDB database and display that data on a Grafana dashboard. If you’re anything like me, then it will only be the start and you’ll be adding more and more sensors to collect more data!
In the next post, we’ll explore some analysis that I’ve done of my home environmental data using RStudio.