This is the first in a series of posts about collecting home environmental data with Raspberry Pis and Pimoroni environmental boards:
- Setting up InfluxDB and Grafana on the Raspberry Pi 4
- Logging Raspberry Pi environmental data to InfluxDB
- Analysing home environmental data with InfluxDB and R
Background
For more than a year now, I’ve been logging environmental data from around my home, indoor and out, with some Pimoroni Enviro boards and Raspberry Pi Zero Ws. I’ve logged more than three million data points now: temperature, pressure, humidity, light level, air quality, and more recently rainfall and wind measurements. The combination of an InfluxDB database and Grafana frontend allows me to see all the data instantly from anywhere.
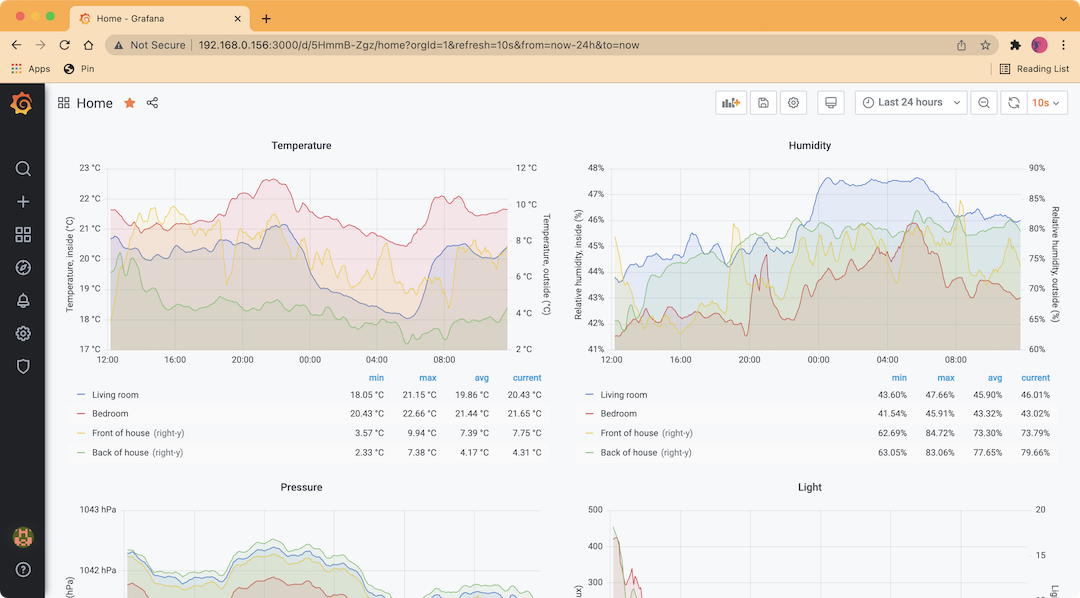
Two Raspberry Pi Zero Ws with Pimoroni Enviro boards collect temperature, humidity, pressure, and light level indoors in our living room and bedroom. Another Raspberry Pi Zero W with a Pimoroni Enviro+ board and PMS5003 particulate matter sensor outside our front door collect the same four variables plus PM2.5 and PM10 particulate (air quality) readings. A final Raspberry Pi Zero W with Pimoroni Weather HAT collects additional rainfall measurements, wind speed, and wind direction.
A Raspberry Pi 4 runs the InfluxDB database and Grafana frontend and also runs nightly backups that get sent to a folder in my Dropbox.
InfluxDB is a database that’s designed specifically for time series data, so it’s perfect for logging the sort of data that I’m collecting. Grafana is a web frontend for building data dashboards, and it’s often used for real time server analytics and such. It can use a variety of data sources but does work very well with InfluxDB in particular.
The whole thing is a complex setup, so I’ll try to cover it as best I can in these three focussed blog posts.
What you’ll need
There’s not much you’ll need for this setup, but I’ll list it anyway:
My Raspberry Pi 4 was set up completely headless, without an attached display, or screen, or keyboard, and there’s no need for any of those.
Installing the Raspberry Pi OS
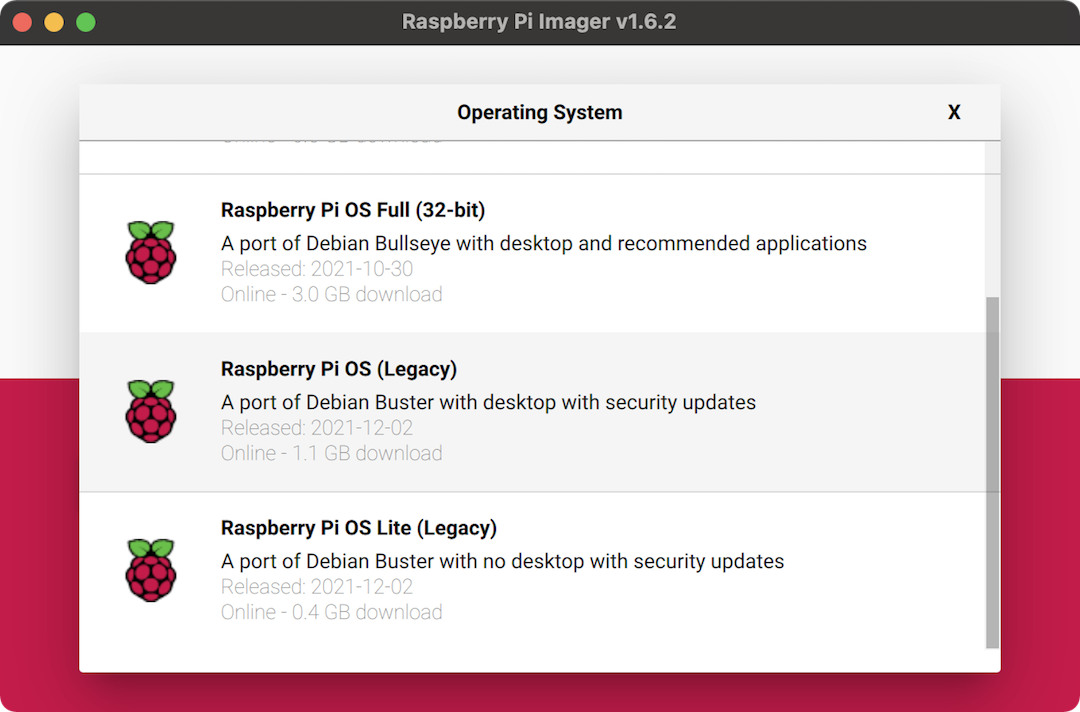
At the time of writing, the new Bullseye release of Raspbian still has some wrinkles to be ironed out in terms of software compatibility, so I’d recommend you use the legacy Buster version that Raspberry Pi have made available.
I like to use the Raspberry Pi Imager to burn the image onto my micro SD card, as it gives handy advanced options for enabling SSH, changing the hostname, setting up wi-fi, and more.
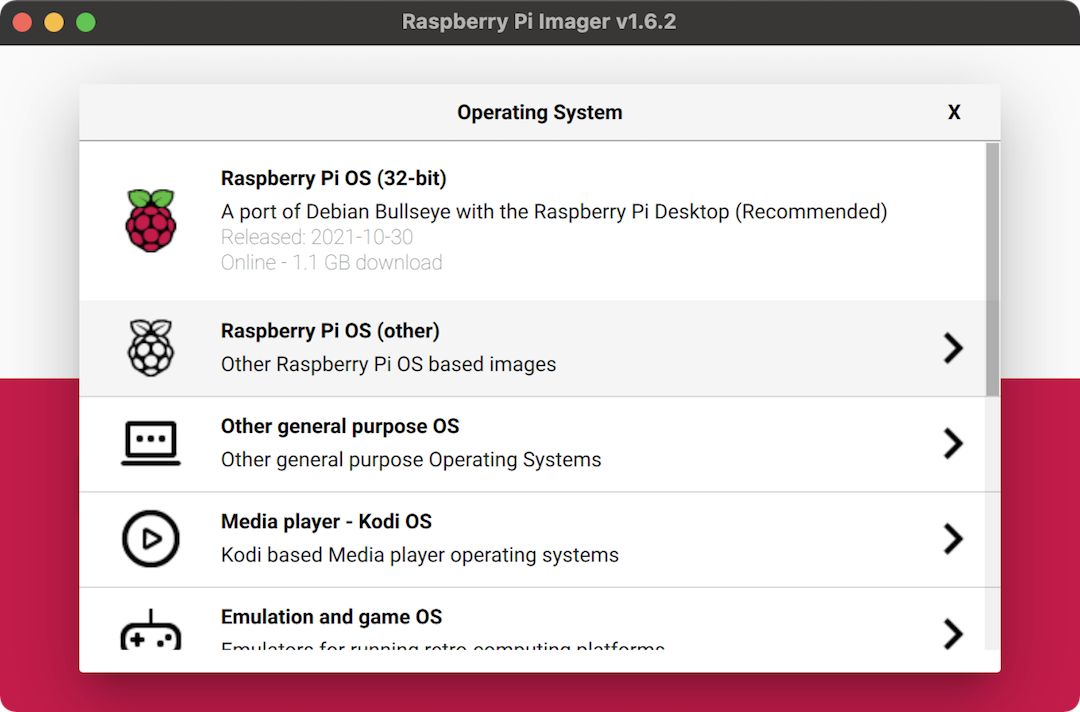
Download, install, and open up the Raspberry Pi Imager, and click “CHOOSE OS”. Select “Raspberry Pi OS (other)”, and then select “Raspberry Pi OS (Legacy)”. Pop the micro SD card into your computer, and then click “CHOOSE STORAGE” and select the micro SD card.
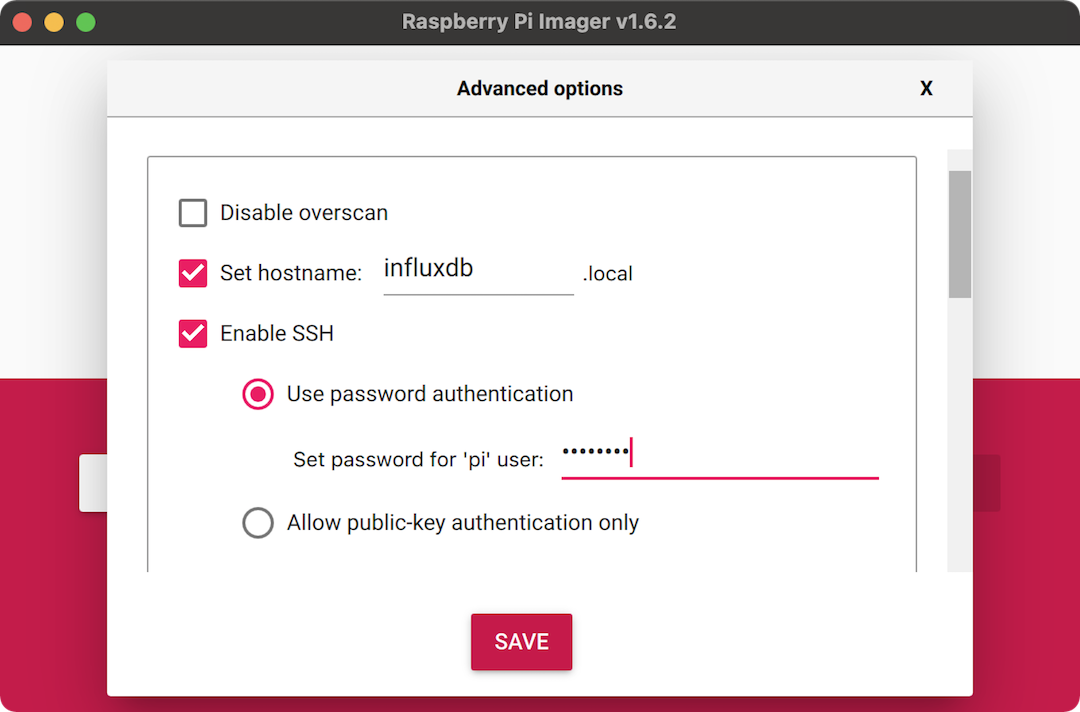
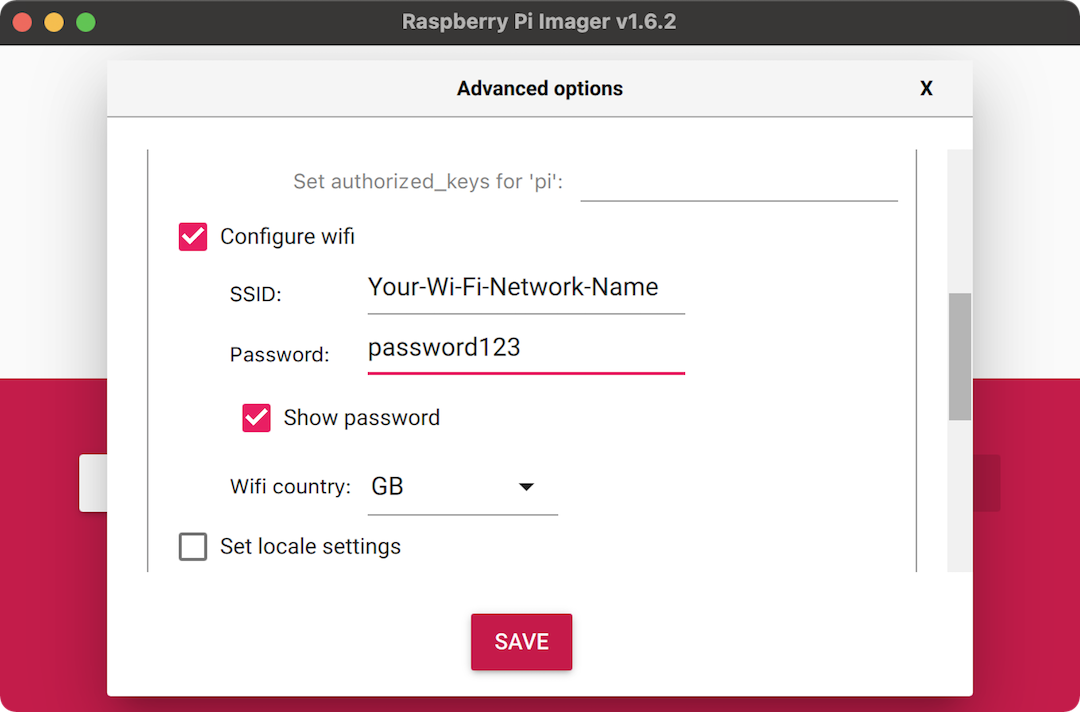
Before clicking “WRITE”, press control-shift-x to open up the super-secret
hidden menu, where you can configure some additional settings. Select the
“Set hostname” checkbox and then call it something like influxdb.local, so you
can find it easily on your network. Also check the “Enable SSH” checkbox and
set the password to something memorable and secure. Scroll down a little and
then select “Configure wifi” and enter your wi-fi network’s SSID and password.
Doing all of this will make it really easy to install everything headlessly
once you’ve burnt the image to the micro SD card and booted up your Pi.
Now click “WRITE” to burn the micro SD card.
Pop the micro SD card into your Pi and plug the power supply in. The green activity LED should light up and blink to show that your Pi is booting up.
Installing InfluxDB
These next two parts, installing InfluxDB and Grafana, are based heavily on Simon Hearne’s excellent tutorial. There are a couple of modifications that I’ve made to the steps, to incorporate the new way of adding GPG keys.
Open a terminal on your computer and connect via SSH to your freshly-booted
Raspberry Pi, by typing ssh pi@influxdb.local or ssh pi@192.168.0.100,
replacing the hostname or IP address with whatever the hostname or IP address
of your Raspberry Pi is. I’d strongly recommend that you set a static IP
address for your Raspberry Pi in your router’s DHCP settings. This will make
sending data to your InfluxDB database from other remote Raspberry Pis much
easier later on.
Once you’ve entered the SSH password (the one that you set when setting up the micro SD card earlier), you should be connected to your Raspberry Pi’s terminal. To pull in all of the latest changes to the packages on your Pi, before we go ahead and install InfluxDB, type the following commands:
sudo apt update
sudo apt upgrade -y
Once that has completed, type the following lines to add the key for InfluxDB and install it:
wget -qO- https://repos.influxdata.com/influxdb.key | gpg --dearmor | sudo tee /usr/share/keyrings/influx-archive-keyring.gpg >/dev/null
echo "deb [signed-by=/usr/share/keyrings/influx-archive-keyring.gpg] https://repos.influxdata.com/debian $(lsb_release -cs) stable" | sudo tee /etc/apt/sources.list.d/influxdb.list
sudo apt update && sudo apt install -y influxdb
Make InfluxDB run as a service (meaning that it will run at boot, and restart if it crashes), by typing the following lines:
sudo systemctl unmask influxdb.service
sudo systemctl start influxdb
sudo systemctl enable influxdb.service
You should now be able to type influx to open an interactive InfluxDB prompt.
To complete the InfluxDB setup, we need to type a couple of things in to this influx prompt, to set up a new database and add a new user with privileges to access it, which we’ll use later when configuring Grafana. Type the following:
create database home
use home

create user grafana with password 'grafana' with all privileges
grant all privileges on home to grafana
You can change the name of your database to whatever you like, and do obviously change the password; just be sure to remember both of them for when we set up Grafana later.
If you type show users in the influx prompt, you should see the following:
user admin
---- -----
grafana true
Type control-d to exit the influx prompt. You’ve now done everything you need
to get InfluxDB set up. On to installing Grafana!
Installing Grafana
Still in your Raspberry Pi’s terminal, via SSH, type the following to add the Grafana GPG key, install it, and run it as a service:
wget -O- https://packages.grafana.com/gpg.key | gpg --dearmor | sudo tee /usr/share/keyrings/grafana-archive-keyring.gpg >/dev/null
echo "deb [signed-by=/usr/share/keyrings/grafana-archive-keyring.gpg] https://packages.grafana.com/oss/deb stable main" | sudo tee /etc/apt/sources.list.d/grafana.list

sudo apt update && sudo apt install -y grafana

sudo systemctl unmask grafana-server.service
sudo systemctl start grafana-server
sudo systemctl enable grafana-server.service
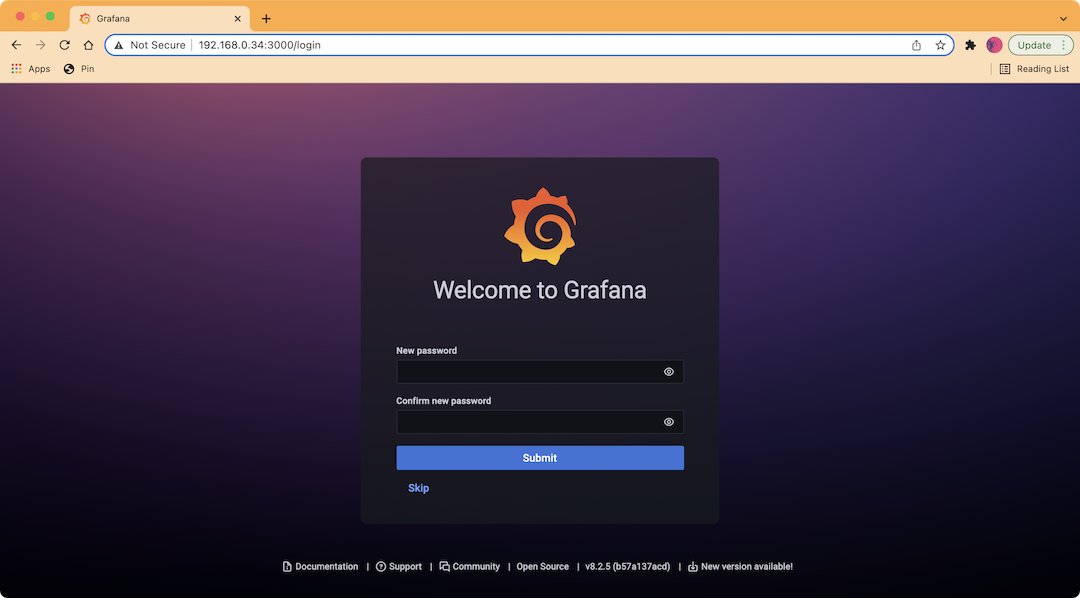
Your Grafana server should now be running, and accessible via a web browser on
your computer. Type http://192.168.0.100:3000 to log in to Grafana, making
sure to use whatever the IP address (or hostname) of your Raspberry Pi is. Log
in with username “admin” and password “admin” and then change the password to
something new when prompted.
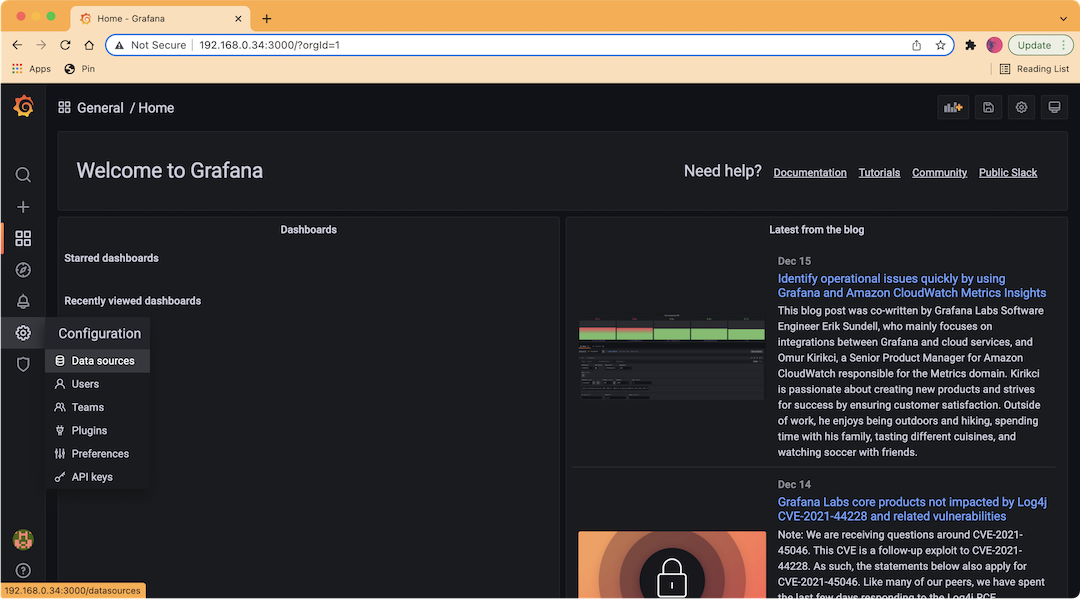
Once logged in, click on the “Configuration” menu (the cog icon) on the left-hand menu bar, and click “Data sources” in that menu. Once on the Data sources page, click “Add data source” and then search for “InfluxDB” and select it. This will bring you to a page where you can configure your InfluxDB data source.
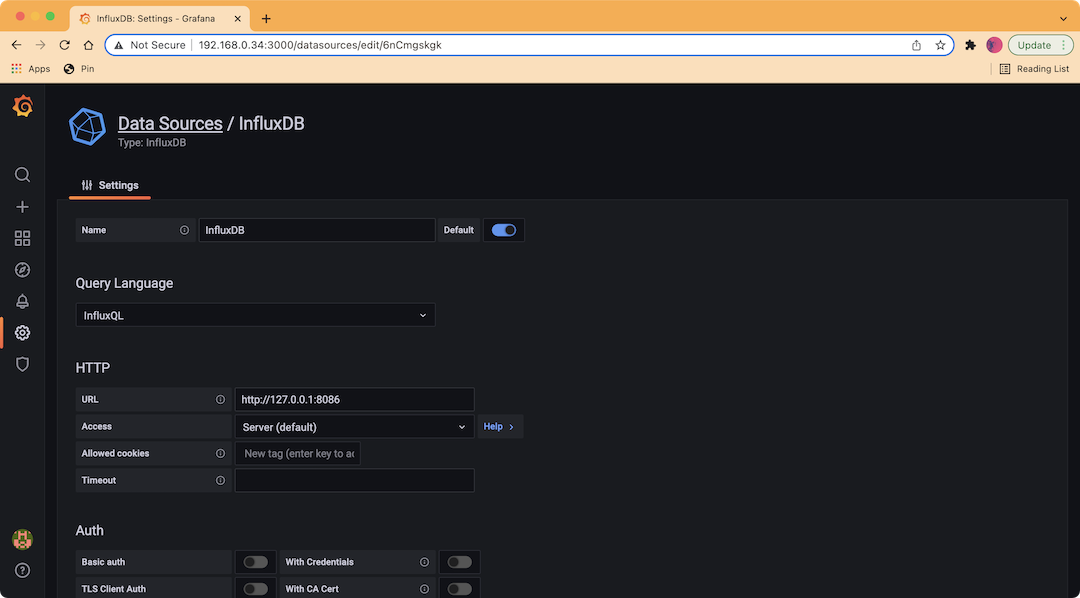
Under the HTTP section, enter http://127.0.0.1:8086 in the URL box.
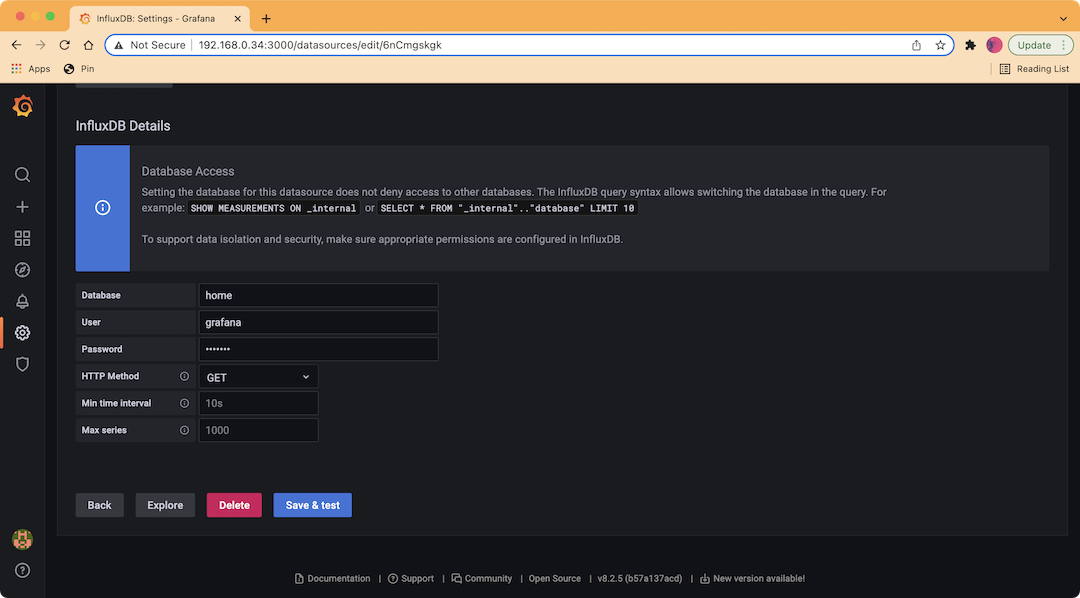
Further down the page, in the “InfluxDB Details” section, enter the database name, user name, and password that you set up earlier through the influx prompt. Finally, click “Save & test” and ensure it says “Data source is working”.
You’re all set! In the next post, we’ll explore how to set up a dashboard and see how to send some data to it from an Enviro board on a remote Raspberry Pi Zero W, using Python.