The last blog posts that I wrote here were a series of three that I wrote exactly a year ago, documenting my setup for recording and analysing environmental data collected with my weather station, Pimoroni Weather HAT, and Raspberry Pi. If you missed those posts at the time, here they are:
- Setting up InfluxDB and Grafana on the Raspberry Pi 4
- Logging Raspberry Pi environmental data to InfluxDB
- Analysing home environmental data with InfluxDB and R
At that point, I only had the weather station set up for around 6 months, so I didn’t yet have a full year’s worth of data to analyse. Fast-forward a year, and I can now analyse a full year’s worth of data from the weather station (well, minus a day or two…)
Since I looked at temperature, light level, and particulate matter previously, I thought I’d focus on rain this time because, y’know, us British folk love to talk about the rain…

Photo by Wenniel Lun on Unsplash
I’ll try to present summaries of the data, as well as trying to answer specific questions like “What was the wettest day of the year?”
The data that I’m analysing here are more than 100,000 values collected at 5 minute intervals from the tipping bucket rain gauge on the weather station. This has a small seesaw-like arm inside it, with small “buckets” on either side that allows one side to fill up and press a switch below it, then it tips that water out and starts filling the other side, etc. The capacity of the buckets is 0.28mm, so that’s the minimum amount that can be measured at any one time and also the resolution of the data.
All of the analysis here has been done in R, using the Tidyverse suite of libraries. I’ll link to a GitHub repository at the end, with an R Markdown document with all of the analysis, and a .csv file with the raw data should you wish to play with it yourself.
October and February were the wettest months
Since most sampling times have no rainfall recorded, 98% of all of the samples taken, using means is not an appropriate way to look at the overall patterns of rainfall through the year (with one exception, later).
A much better way is take the daily, weekly, or monthly sums of the rainfall. This includes all of the data, and takes account of the periods that have the most rainfall properly.
The plot below shows the total rainfall for each month this year. We can see that October was the wettest month, with 133mm total rainfall. February was the second wettest with 126.6mm rainfall.
This fits with our expectation that the spring and autumn months are most likely to be the wettest. However, looking at the trendline on the plot, we can see that February is somewhat of an outlier and that March and April were two of the driest months of the year. The autumn months September, October, and November were some of the wettest though.
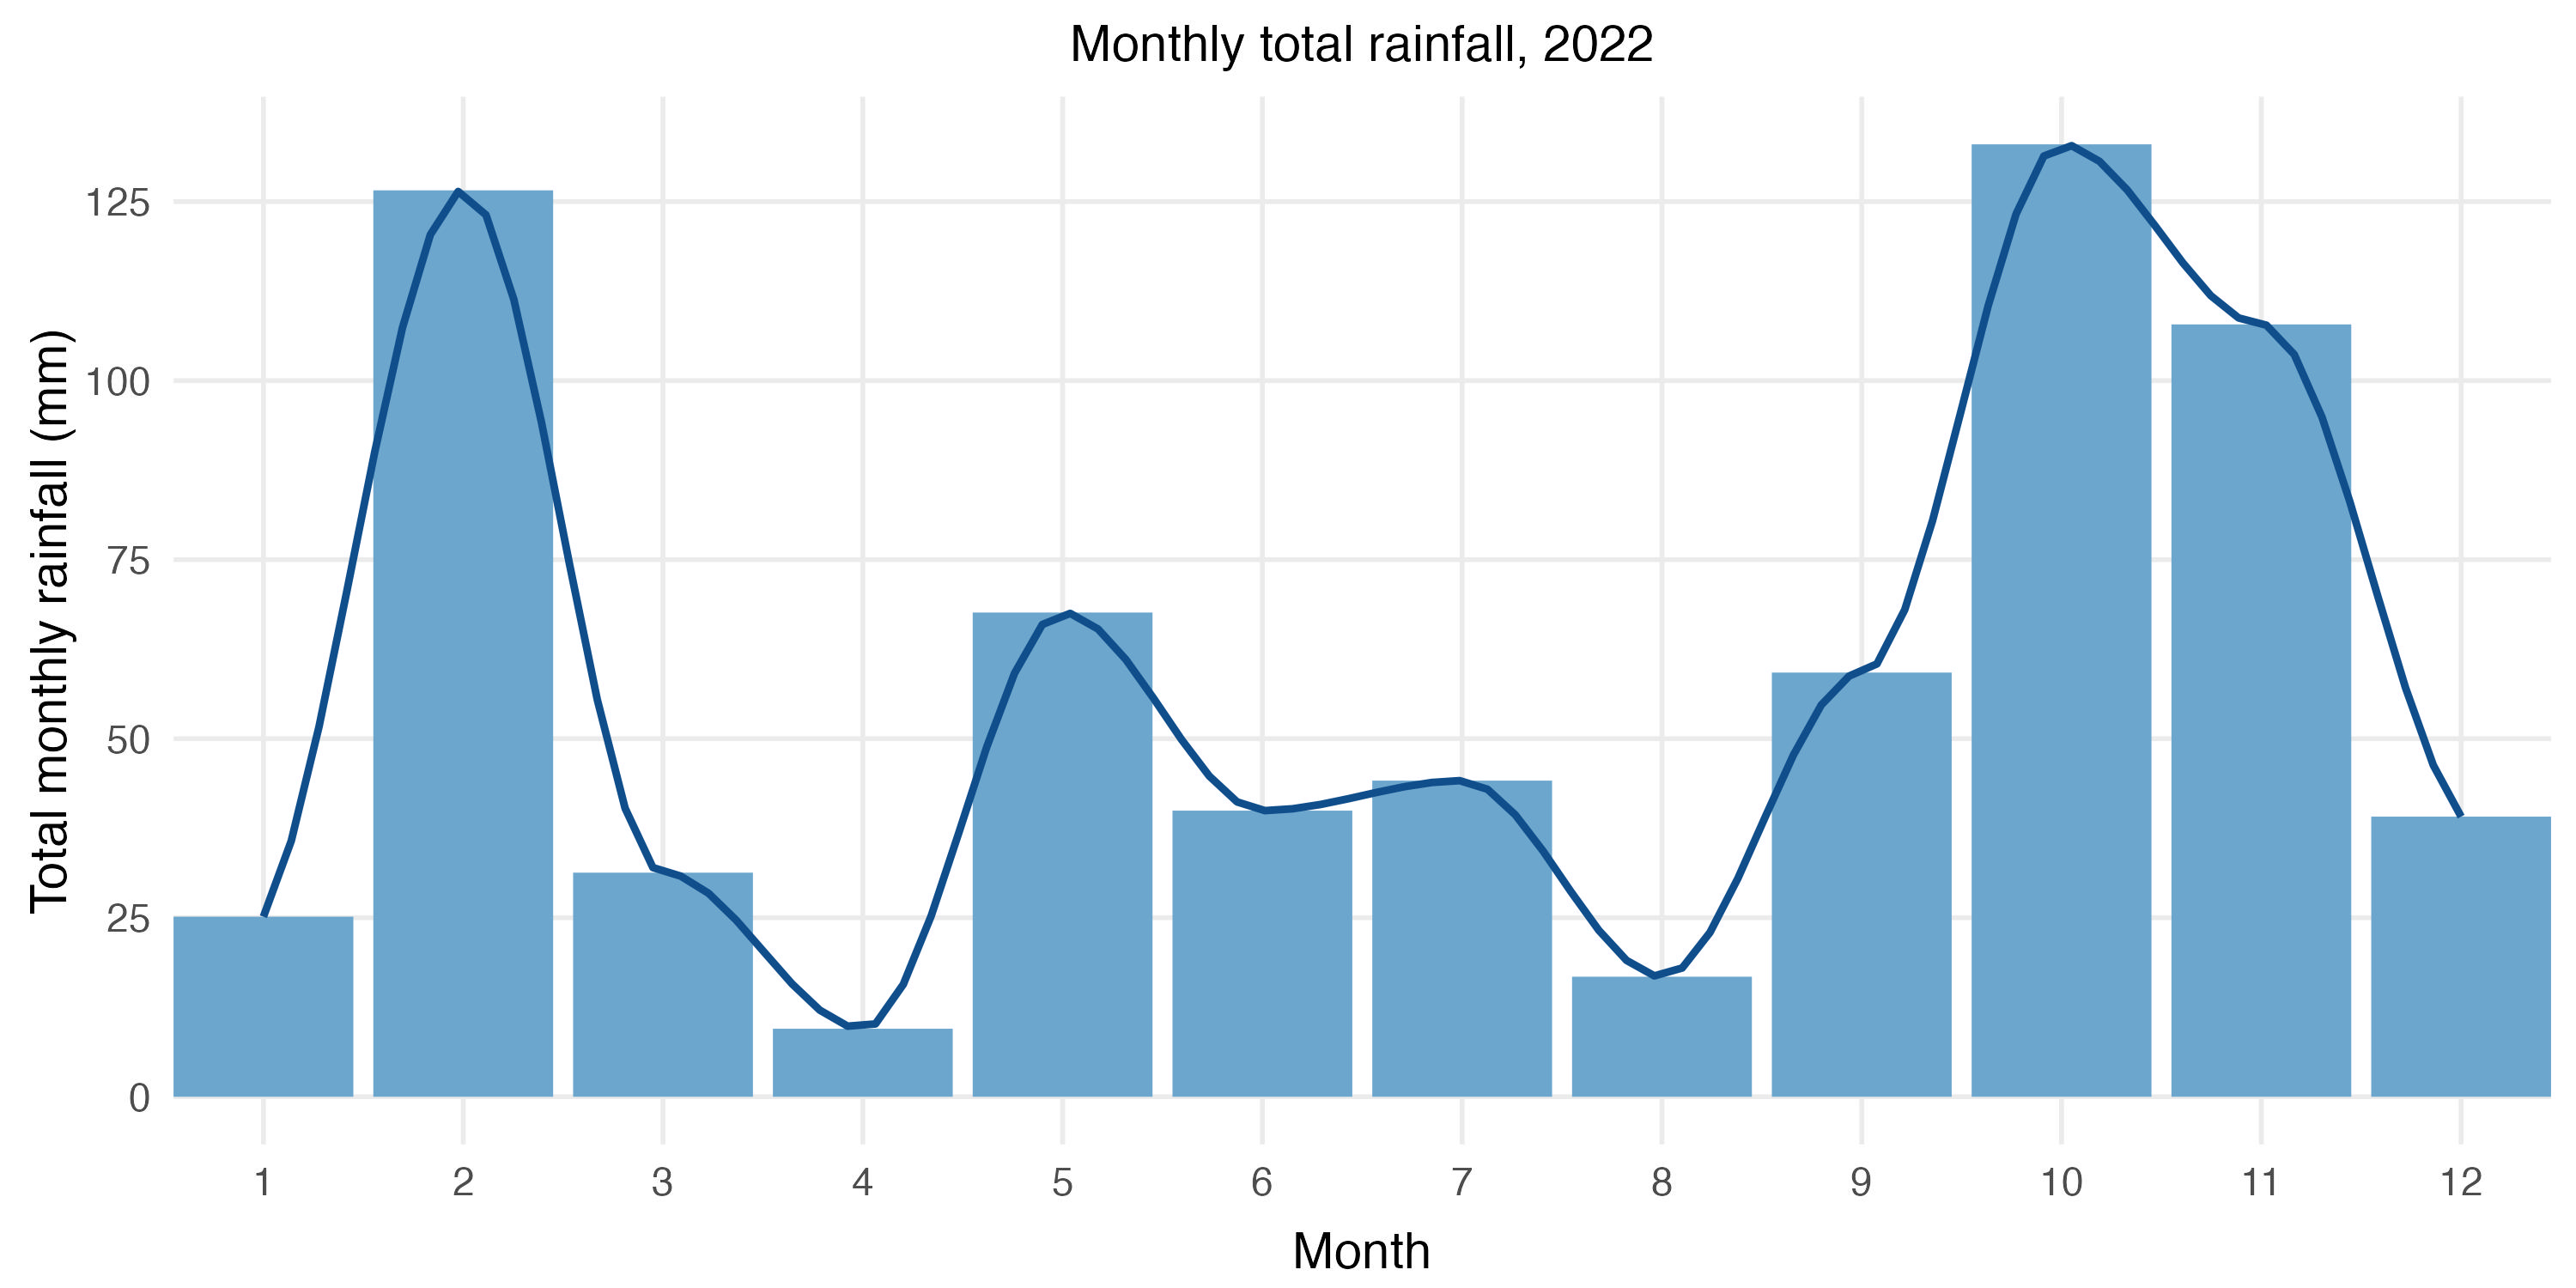
Here are the monthly total rainfall values ranked from most to least rainfall. This shows that April was actually the driest month, with just 9.5mm rainfall in the whole month. So much for April showers! March was also relatively dry, with 31.3mm total rainfall, making it the fourth driest month.
| Month | Rainfall (mm) |
|---|---|
| October | 133.0 |
| February | 126.6 |
| November | 107.8 |
| May | 67.6 |
| September | 59.2 |
| July | 44.1 |
| June | 40.0 |
| December | 39.1 |
| March | 31.3 |
| January | 25.1 |
| August | 16.8 |
| April | 9.5 |
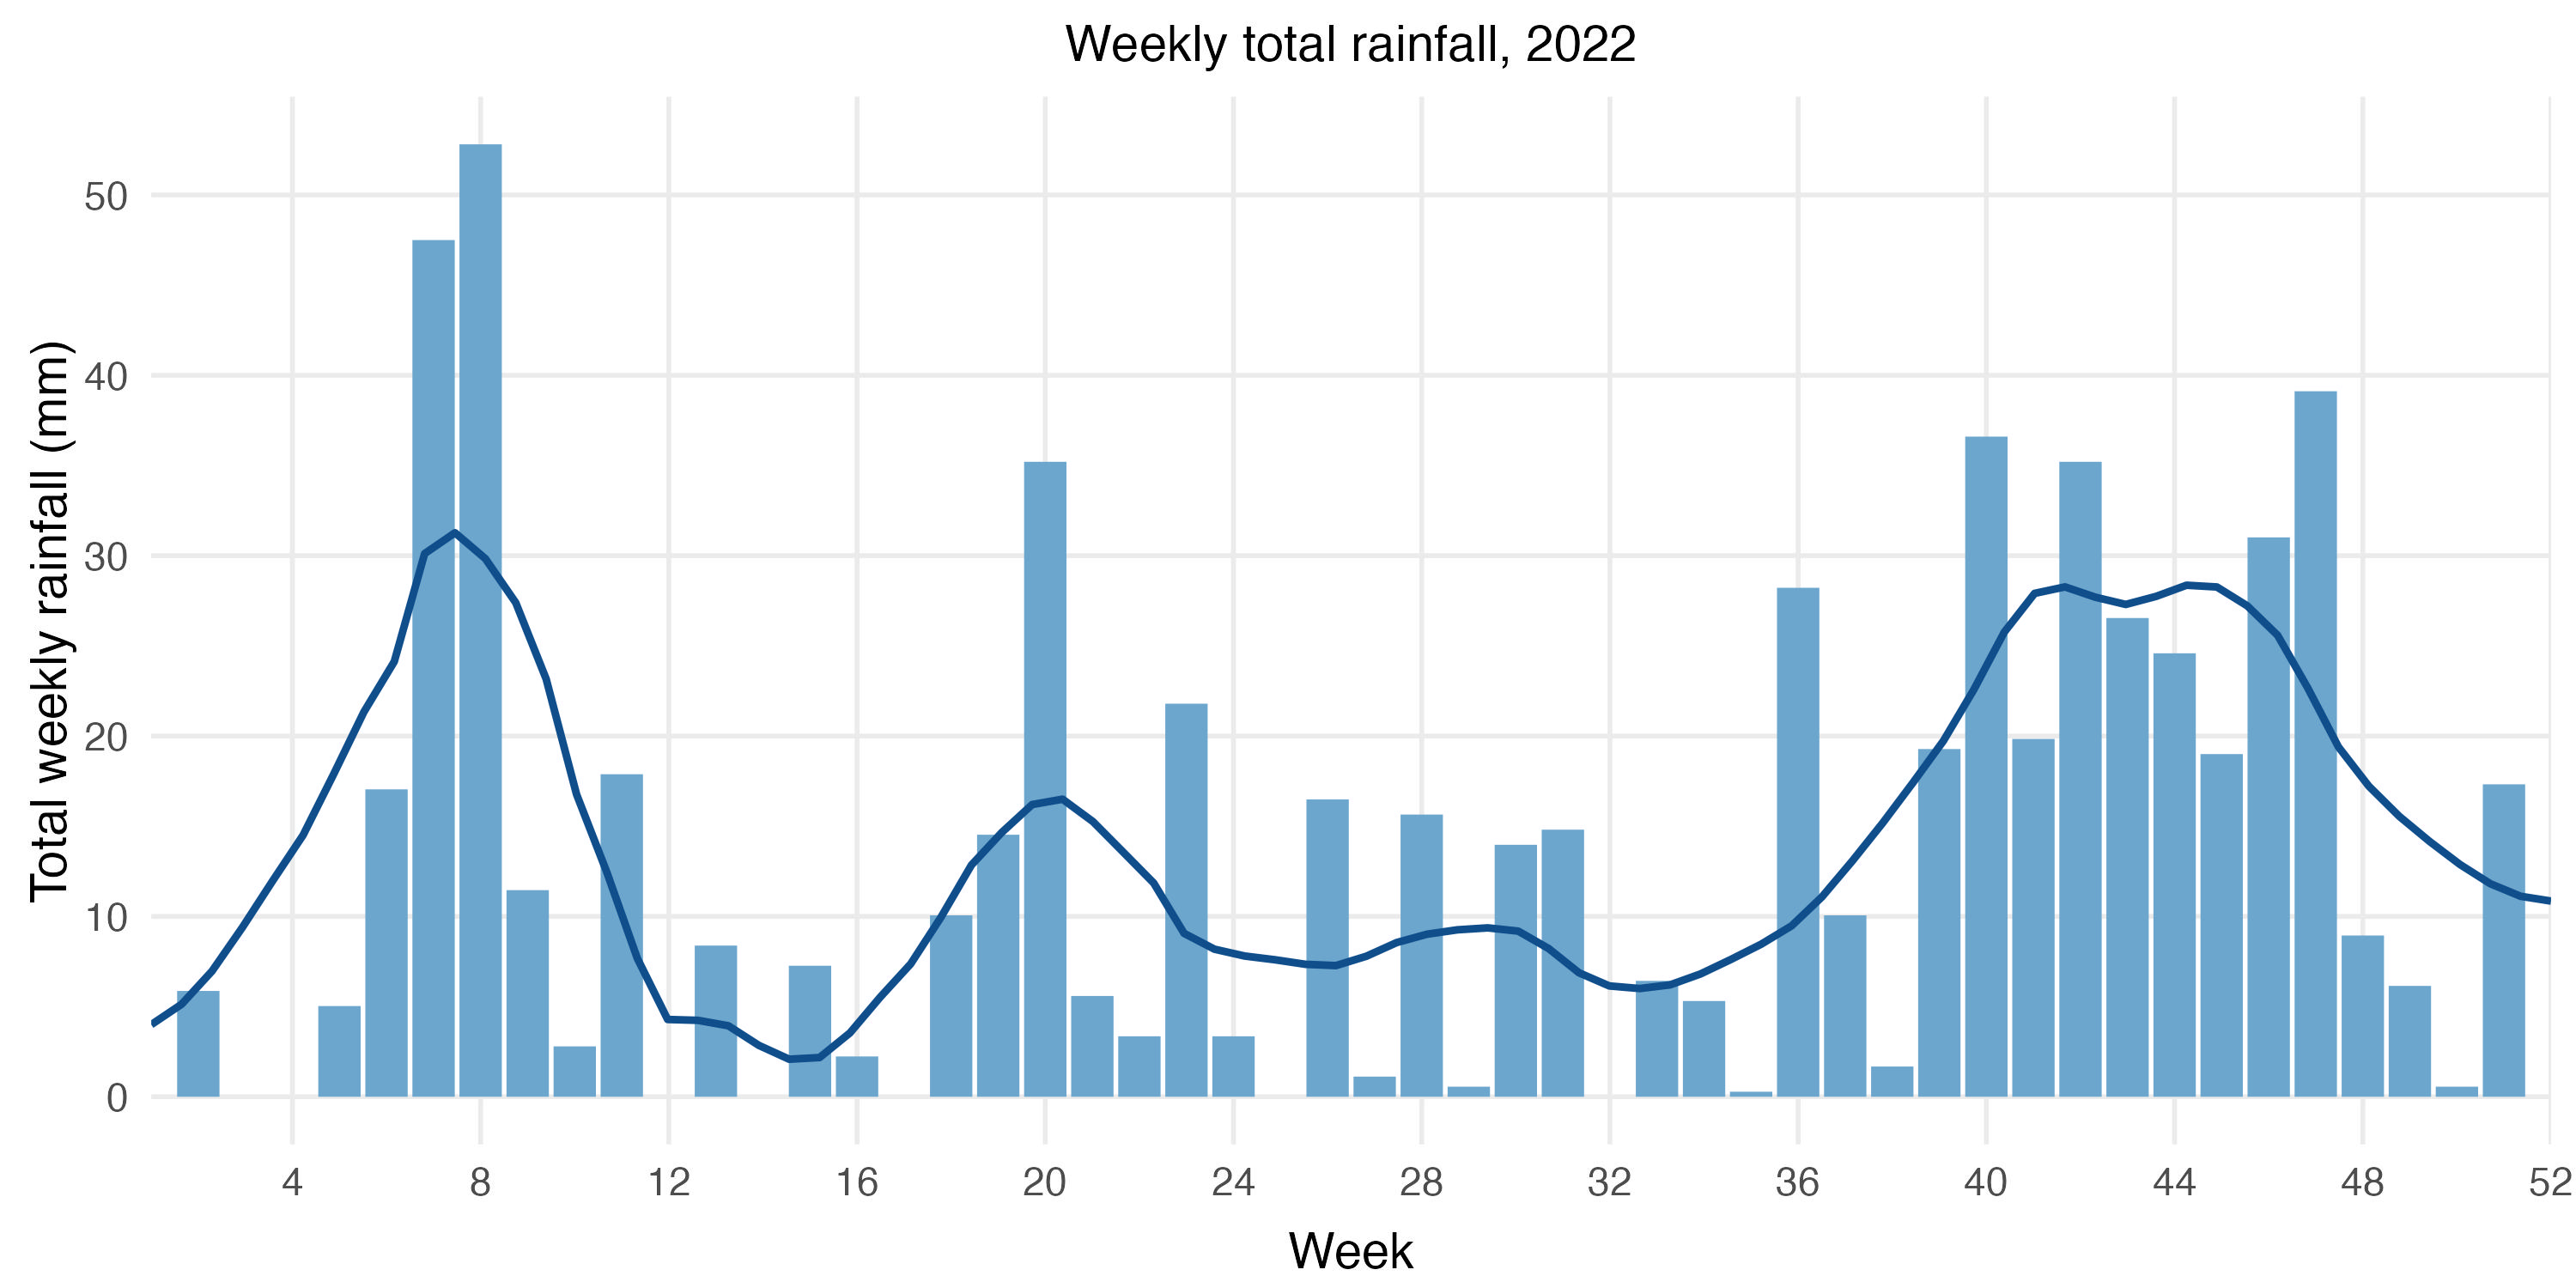
Looking at the weekly total rainfall gives us more granularity than the monthly totals. For instance, we can see that the majority of February’s rainfall was in two very rainy weeks at the end of the month, whereas the wet weather in autumn was more evenly spread across the weeks. Every week from the end of September through to the the end of November had 19mm or more total rainfall. Bleurgh!
Two of the five wettest days were in February
Which was the wettest day of the year?
By taking the daily total rainfall and then sorting from largest to smallest, we can see that the 18th of February was the wettest day of the year, with 24.3mm of rainfall. That’s more rainfall than there was in either April or August, and about about the same amount as January’s total. The third wettest day was two days earlier, on the 18th of February.
| Date | Rainfall (mm) |
|---|---|
| 20 February | 24.3 |
| 20 October | 23.5 |
| 18 February | 21.0 |
| 16 May | 18.4 |
| 17 November | 15.4 |
April was the driest month
As well as using the monthly total rainfall as a measure of how wet or dry a month was, we could also use the number of dry days, i.e. those without any rainfall at all, as a way to gauge how wet or dry a month was.
Doing so should better account for months where there were a lot of dry days and then one or two days with unusually high amounts of rainfall.
By this measure, April was still the driest month, and October the wettest.
It lets us see that the four driest months (by number of dry days) were in the first half of the year. No doubt this is what led to the reservoirs running low and subsequent hosepipe bans through the summer (some of which are only just now, as this is written, being lifted).
| Month | Num. of dry days | Half of year |
|---|---|---|
| April | 26 | first |
| January | 21 | first |
| March | 21 | first |
| June | 20 | first |
| August | 18 | second |
| July | 16 | second |
| December | 14 | second |
| September | 12 | second |
| May | 11 | first |
| February | 10 | first |
| November | 8 | second |
| October | 7 | second |
January had the longest dry spell
Defining a dry day as a day with zero rainfall, and a wet day as one with greater than zero rainfall, we can find the longest dry and wet spells through the past year.
Perhaps surprisingly, the longest dry spell was a period of 15 days between 15th January and 29th January 2022.
Less surprisingly, the longest wet spell was between 15th and 27th November, 13 consecutive days where it rained. Autumn weather in the UK sucks!
Late morning was the wettest time of day, on average
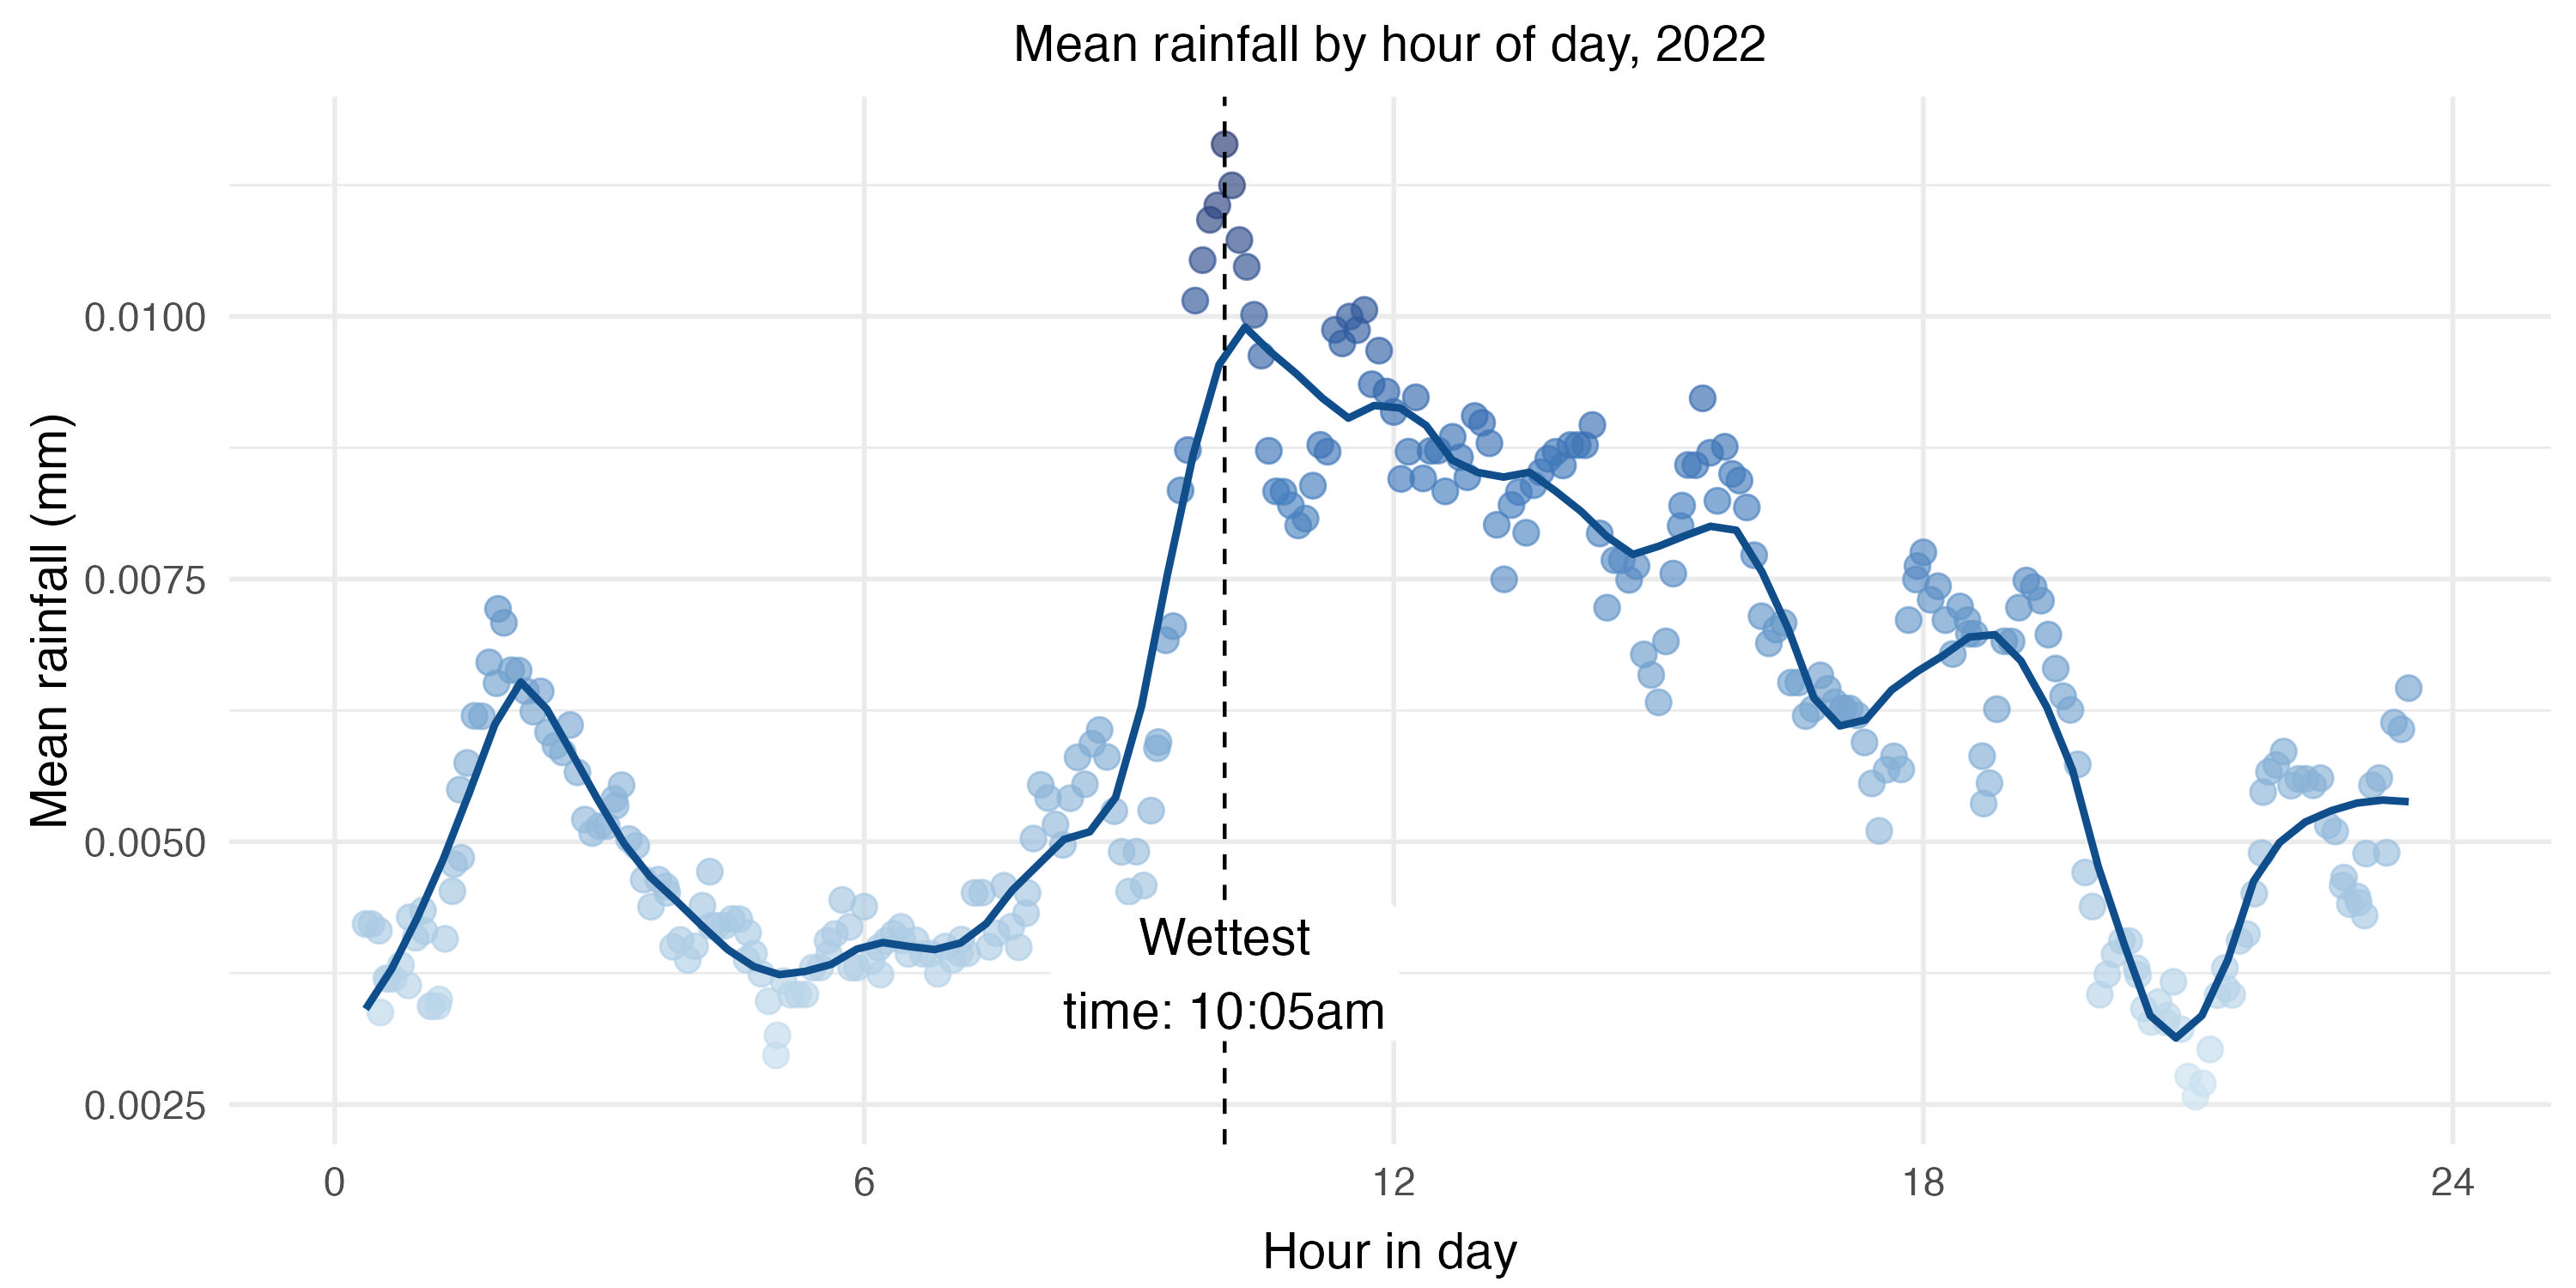
By averaging the rainfall at each timepoint through the day, across the whole year, can we see when the wettest time of the day was? The plot below shows the mean rainfall, in millimetres, through the day, with a trendline fitted to the points.
It’s pretty noisy data, but it looks like late morning was the wettest part of the day, on average, with 10:05am being the wettest time of all. The general trend seems to be that it was drier in the early morning, increasing through the morning towards the middle of the day, then tailing off through the afternoon.
I think this makes sense, since once the sun rises in the morning the air will heat up, hold more moisture, and hence be more likely to rain.
(some outliers have been removed around the 10am peak to better see the patterns in the rest of the data)
The heaviest downpour was on 20th October
If we group and sum the rainfall by hour of day on every day of the year, we can find the single hour where there was the largest amount of rainfall, i.e. the heaviest downpour.
The five heaviest downpours are shown in the table below (there were three downpours with 5.6mm of rain, hence the seven values). The heaviest downpour was at 10am on the 20th of October, with 11.2mm of rain in an hour.
This is more rain in a single hour than there was in the whole month of April!
Looking back at the wettest days of the year, the 20th of October was also the second wettest day of the whole year.
| Time/date | Rainfall (mm) |
|---|---|
| 20 October, 10am | 11.2 |
| 9 May, 11am | 10.1 |
| 8 June, 1am | 6.1 |
| 7 October, 11am | 5.9 |
| 16 February, 3pm | 5.6 |
| 8 November, 1pm | 5.6 |
| 24 November, 3pm | 5.6 |
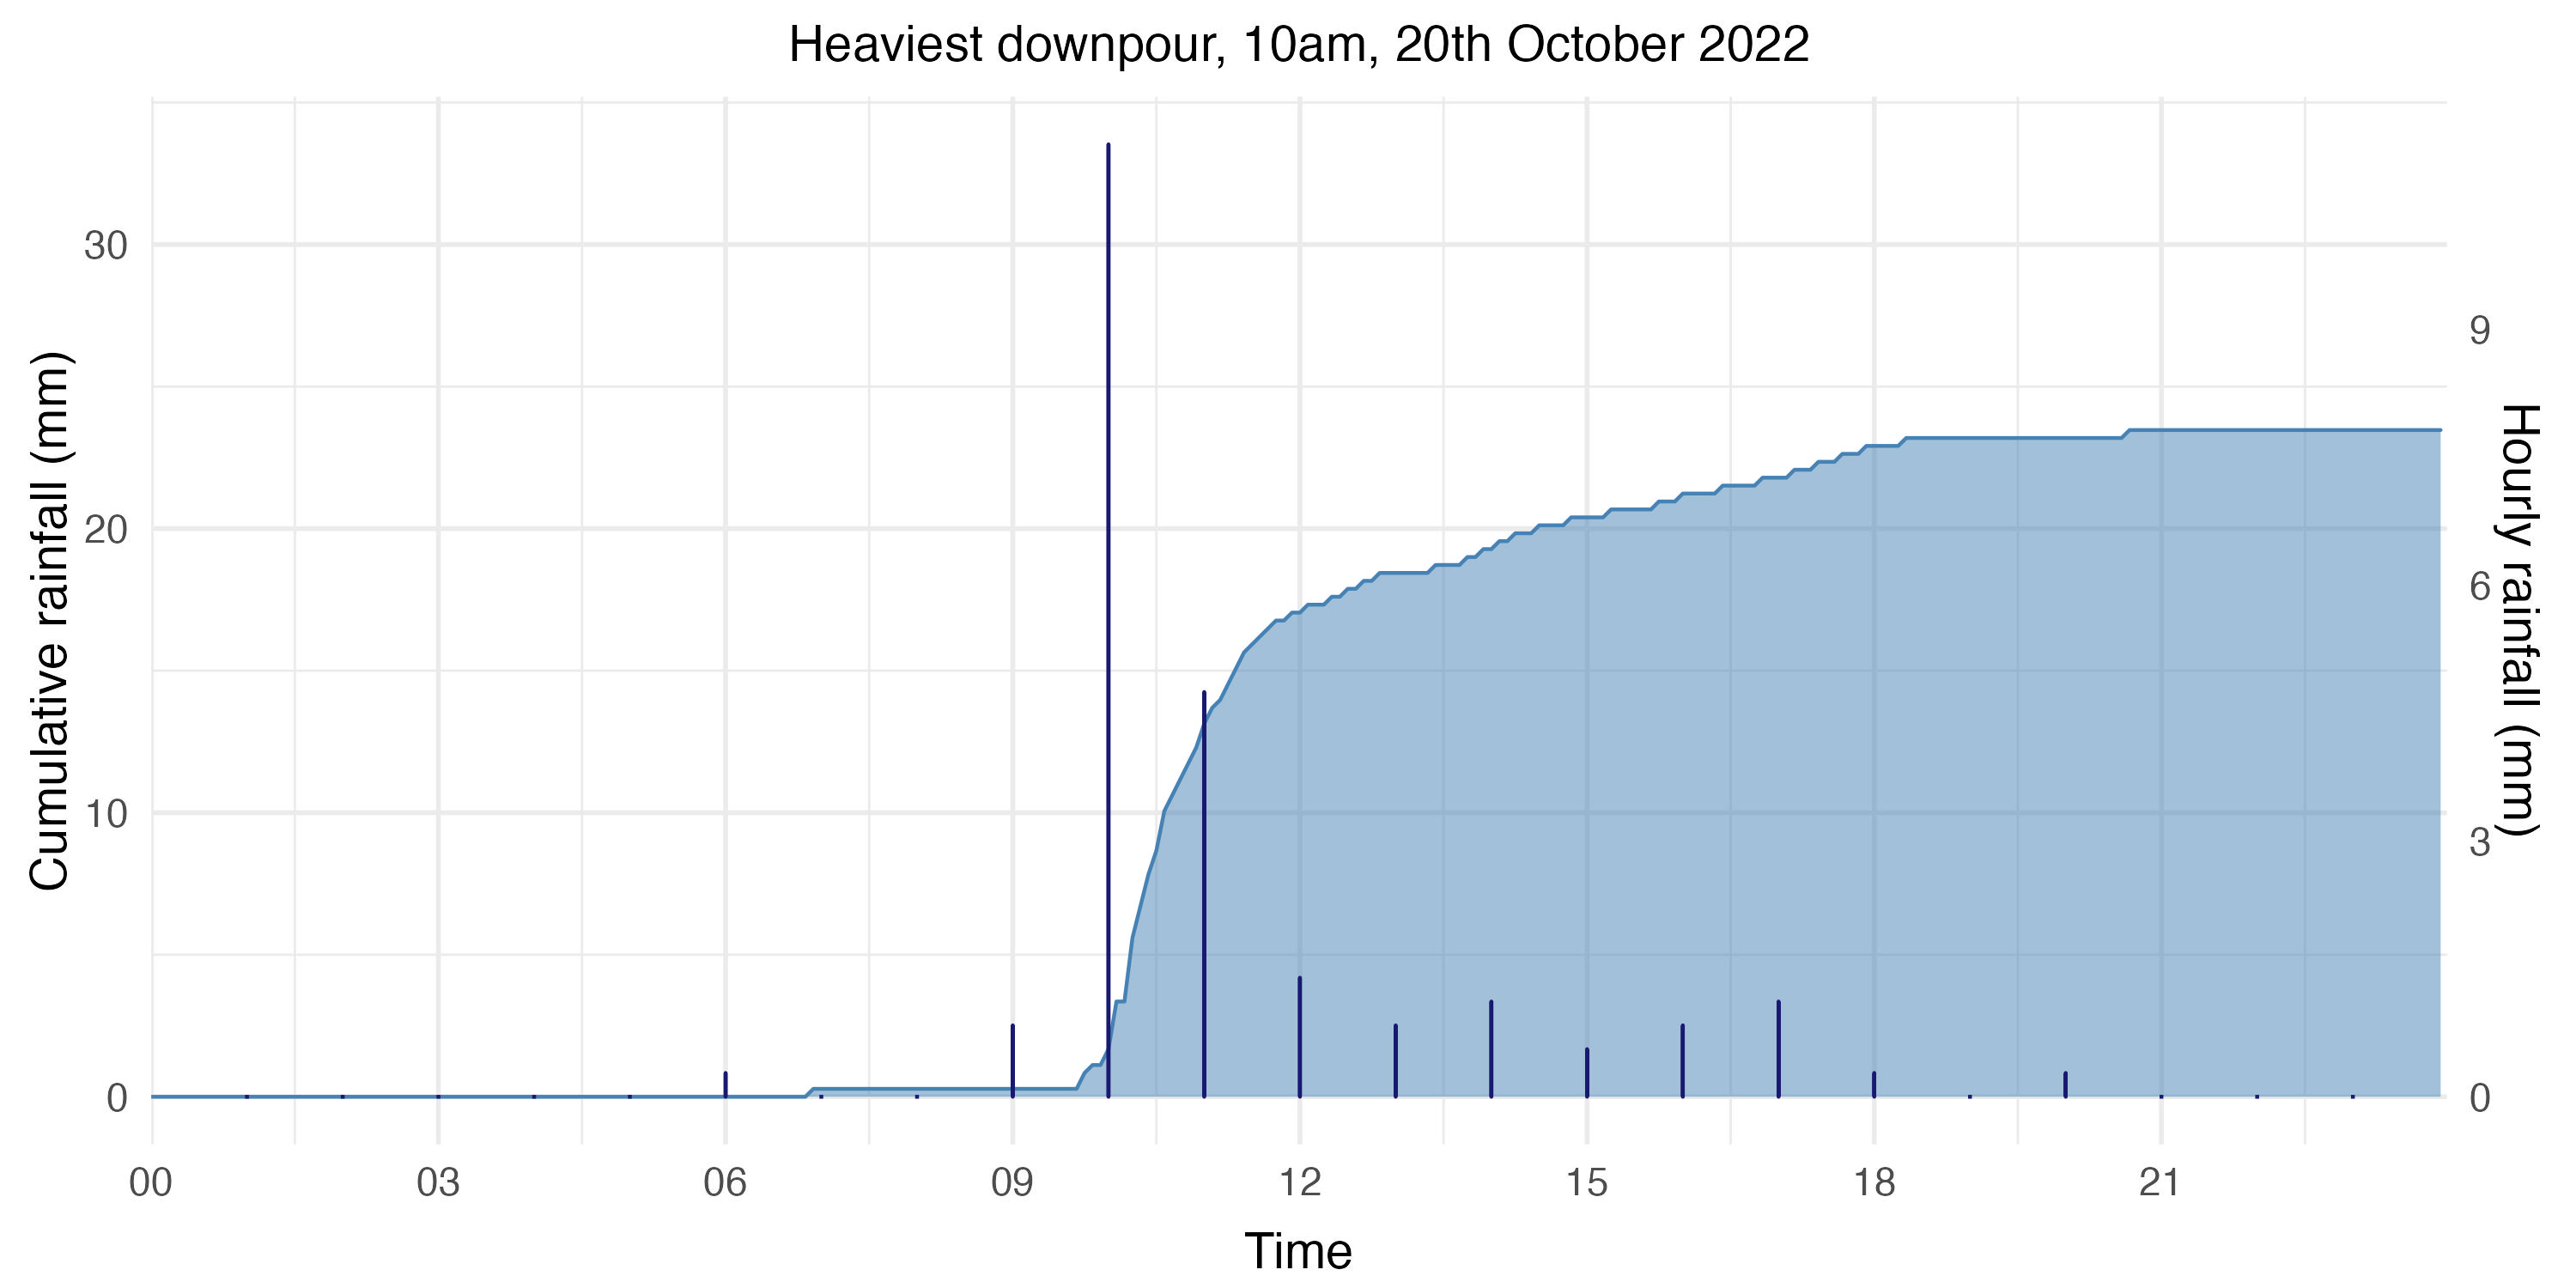
Let’s look in detail at what happened on that day, 20th October.
The plot below shows the cumulative rainfall through the day as the filled area with the values on the left-hand y-axis, and the hourly rainfall as the tall, thin bars with the values on the right-hand y-axis.
We can see exactly when the downpour happened, between 10 and 11am, when the cumulative rainfall shoots up. After the initial downpour, the intensity of the rain tails off over the next few hours. I’m no meteorologist, but I would imagine this was a frontal system passing over us, with the heavy rain at the leading edge.
R Markdown files and raw data
If you’d like see how I analysed the data, produced the plots, and so on, I’ve created an R Markdown file with it all in, as well as a .csv file with the raw rainfall data if you’d like to play around with it yourself.